The following are futures positions of non-commercials as of January 20 (Tuesday). Change is week-over-week.
Dollar index, gold and euro jump out the most.
10-year note: It seems non-commercials’ patience is wearing thin. On top of that, this has not been a profitable trade. Since they accumulated 261k contracts (highest since mid-May 2010) in net shorts at the end of December, the 10-year yield has dropped another 30 basis points. So they are cutting back. Currently non-commercials are net short 145.6k, down 36k w/w. Nonetheless, it is still a sizeable total. Plenty of room for possible squeeze.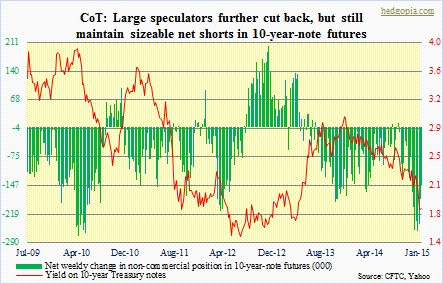
30-year bond: Are these traders giving up? Or getting squeezed would be another way to look at it. Makes you wonder. The 30-year Treasury yield dropped again this week. Net shorts in 30-year-bond futures dropped as well. They have not been net long the past five weeks, and during this time the yield has dropped from 2.76 percent 2.39 percent. Not good. Currently net short 5.4k, down 13.9k.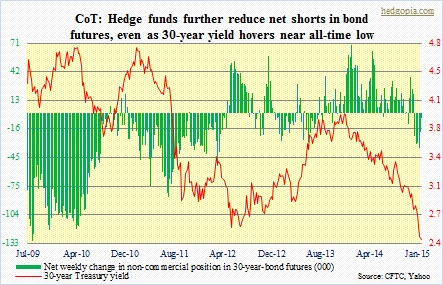
Crude oil: Net longs dropped a little, but are highest since early October. Technically, the WTI is way oversold, yet cannot catch a break. The weekly RSI is at 10! But who wants to catch a falling knife? Sentiment is very negative, unless someone wants to go contrarian. On a daily chart, the crude seems to have fallen out of a bear flag. It is not clean, so we will have to wait what next week brings. If it is a flag, then it is supposed to be a continuation pattern, meaning more price pressure ahead. Currently net long 43.8k, down 6k.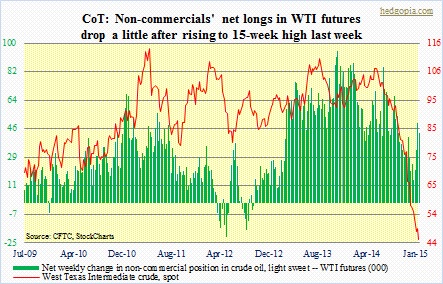
E-mini S&P 500: From an 18-month high two weeks ago, net longs are now down more than 50 percent. This obviously does not include the Thursday surge in stocks post-Eurozone QE. But it was interesting to see these specs cut back into strength. Last Friday, the S&P 500 jumped 1.3 percent, and was up again Tuesday. Currently net long 78.7k, down 37.2k.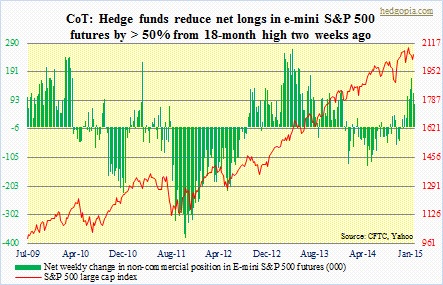
Euro: Unreal! There is no other way to describe it. After what looked like an exhaustion gap Thursday and Friday last week, the euro (represented by FXE) went on to drop another three percent this week. As is the case with the dollar, these traders have done a marvelous job of getting the direction right. Post-ECB QE decision on Thursday, the past couple of sessions were gap downs. As if this matters in this central bank-manipulated world, I am going to throw it out there anyway. A downtrend line drawn from the December 2004 high of 135 (FXE, which closed Friday at 110.33) extends to 105 to 110 (kind of a hurricane cone). Currently net short 180.7k, up 12.8k.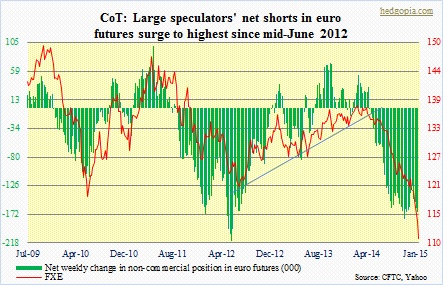
Gold: Look at that spike in net longs – now highest since mid-December 2012. Spot gold sold for just under $1,500/ounce back then, but it was caught in a vicious downward spiral. Now, things are different. Though it is only recently that sentiment began to turn positive for the metal. To boot, there have been some technical breakouts. Near-term, the spot likely comes under pressure. Technicals are way overbought. Plus, resistance seems to be holding (blue line in chart). The 200-day moving average is at $1,255 and what happens around that level should be a good tell. Net longs currently 162.5k, up 32.2k.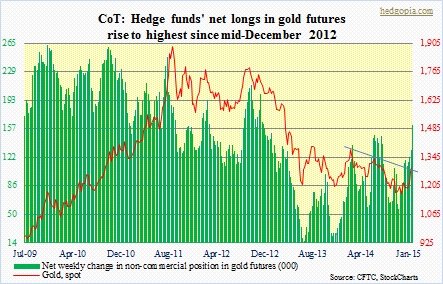
Nasdaq 100 index (mini): Last Friday, the crucial 4100 support was saved on the Nasdaq 100, and this week bulls were able to build on that. Let us see if they can push this thing through a two-month-long downtrend line (blue line in chart). The index closed Friday right underneath that. Having said that, as was the case with the S&P 500, these traders have failed to embrace last Friday’s rally with open arms. Net longs are lower. Currently net long 28.5k, down 9.2k. (Reminder: AAPL, GOOG, among others, report next week. Post-earnings reaction matters for NDX.)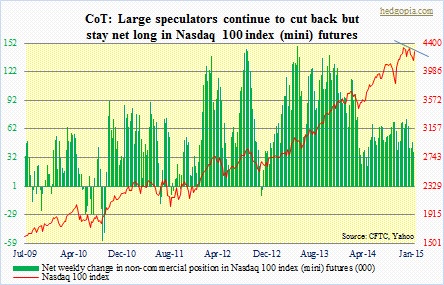
Russell 2000 mini-index: The index is less than three percent away from its all-time high recorded less than a month ago. Nonetheless, these specs are maintaining their net shorts. Size is not that big, but it has gradually risen the past couple of weeks. It is time for small-cap bulls to muster up some strength. The index is literally sitting on two-month-long resistance. A month ago, a break out of 1200-1210 failed, followed by a drop back into a year-long range. Currently net short 27.9k, up 1.3k.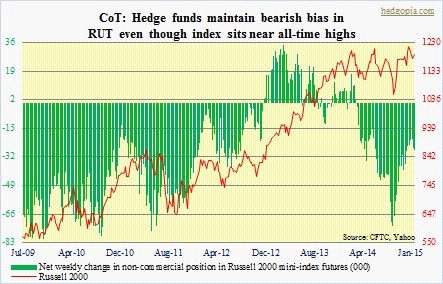
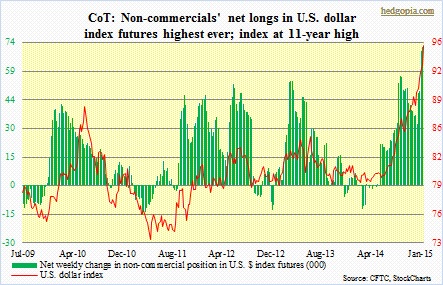
U.S. Dollar Index: Yet another high. Net longs are highest ever. Both the red line and the green bars have parabolic look to it, but you have to hand it to these traders. They have ridden this thing so well. With one week to go, January is on its way to becoming the 7th consecutive up month, which will be the first time going back to at least 1995. This week’s surge has taken out yet another resistance. Overbought to the gills, nonetheless momentum is intact. A reversal, whenever that is, is bound to be painful. Currently net long 73.2k, up 1.2k.
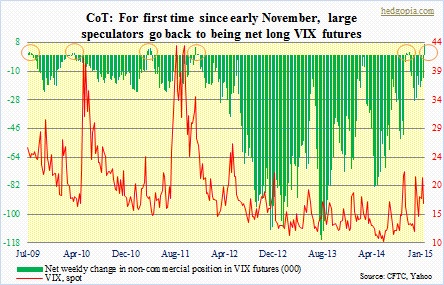
VIX: The index dropped 20 percent last week. As of Tuesday, it was down 10 percent. That is when these traders flipped from being net short VIX futures to net long. In the next three sessions, the VIX dropped another 10 percent. In the past, from the time large speculators went net long VIX futures (orange circle in chart), spot VIX in due course went lower, which by default meant higher stock prices (more on this, here). We will just have to wait and see if this plays out similarly this time around. Currently net long 7k, up 21.2k.