The following are futures positions of non-commercials as of February 3 (Tuesday). Change is week-over-week.
10-year note: The 10-year yield has risen from 1.65 to 1.94 in five sessions. But it also dropped 52 basis points in January, and that squeezed a lot of large-spec shorts. Net shorts were 261k five weeks ago; they now stand 54 percent below that high. By Monday, there were signs yields on the long end were headed higher. Tuesday, the 10-year did rise 11 basis points. Yet, non-commercials were tentative. They did add to net shorts, but were not aggressive. Friday, the 10-year yield was up 12 basis points, reacting to January’s jobs report. It will be interesting to see how these traders will react next week. The two-percent level on the 10-year holds the key. Currently non-commercials are net short 118.8k, up 10.9k w/w.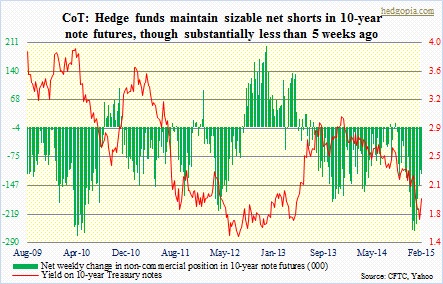
30-year bond: Net shorts are down by more than half from four weeks ago. The 30-year yield pushed higher this week. And non-commercials don’t have enough short exposure. They still have some, but not a whole lot. The key would be their reaction next week. Both on the 30- and 10-year, shorter-term moving averages are curling up, so conditions are setting up just right for these yields to move higher. The only question is for how long. Currently net short 15.3k, up 5.2k.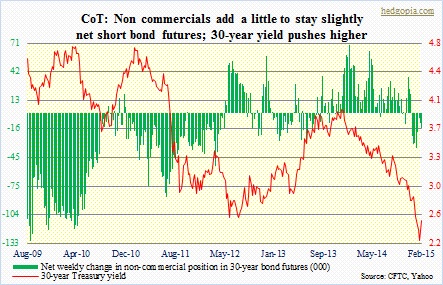
Crude oil: First off, the chart combines both NYME and ICE futures. As can be seen, these traders have doggedly stayed married to their net longs. Sort of. They started cutting back mid-June, coincident with the peak in crude. The WTI continued heading lower come 2015, but these traders started adding as soon as the year began. Importantly, it has held 47 support. Participation is building. Momentum really builds IF it can take out 50DMA (54.35), a little less than four percent away. One possibility behind the recent rally: prevailing deep contango is giving physical traders an incentive to store crude and benefit from the carry. Currently net long 299.3k, down 16.7k.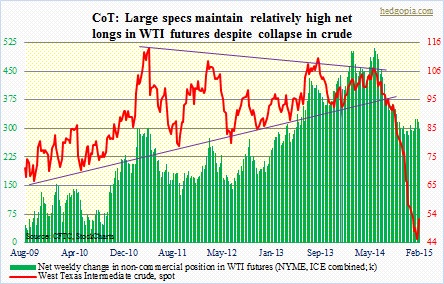
E-mini S&P 500: Four weeks ago, they were net long 171k contracts. Now they have 49 percent less. They added a little in the week, though. Positions are as of Tuesday. After the rally this past Monday and Tuesday, the S&P 500 closed the week essentially flat. Bulls were able to retake the crucial 2000 as well as the 50DMA. Deep down, there does not seem to be much conviction in the move. Daily indicators are now beginning to get overbought. Given this, it is tough to argue these traders will aggressively add to net longs next week. Currently net long 87.2k, down 9.9k.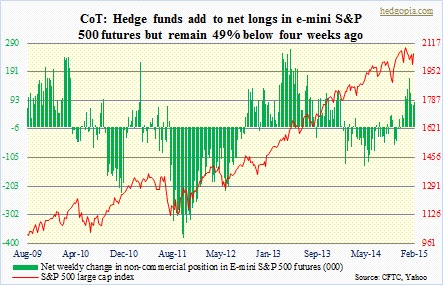
Euro: It has been such a winning trade for these traders. So they are going for more. They added more to their already humongous looking net shorts. 18k more, and they will match the high of early June 2012. The euro had a little nice rally until Friday, when the dollar surge pushed it back down. The 20DMA proved too big of a resistance for the euro. Currently net short 196.3k, up 11.6k.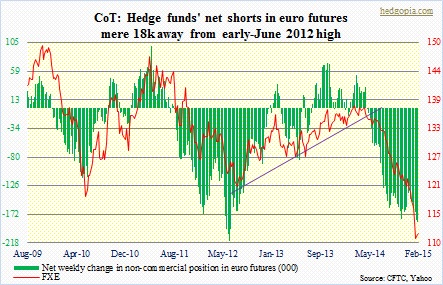
Gold: The March 2014 downtrend line proved to be too much of a hurdle for the metal. Friday, it could not keep the 200DMA, and is a hair’s breadth away from the 50DMA. These traders obviously were not expecting this kind of a drop. (Friday, the metal fell 2.5 percent.) They continue to maintain net longs which are near two-plus-year high. Gold seems headed down in the near term. Currently net long 185k, down 3.9k.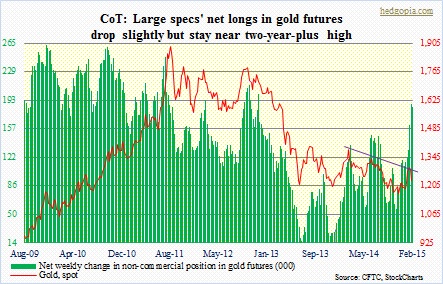
Nasdaq 100 index (mini): The index rallied strongly on Monday and Tuesday. This has not convinced these traders to aggressively add to net longs. They maintain a small exposure, which is down substantially from two months ago. The index is still caught in a descending triangle. There are times such triangles act as reversal patterns at the end of an uptrend. That 2100 support better hold. Currently net long 20.2k, up 0.495k.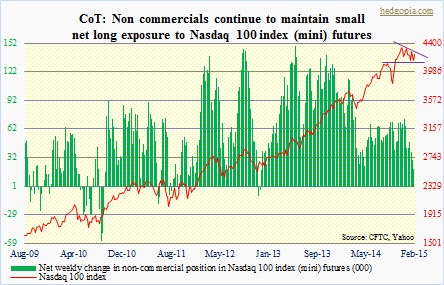
Russell 2000 mini-index: As did several other indices on Monday, the Russell 2000 small cap index saved must-hold support. On Friday, the subsequent bounce was repelled at the top of the wedge (chart uses closing price, which was lower than the intra-day high). The index sits merely 16 points off of its late-December all-time high. Yet, large specs do not act like they believe in the move. They have maintained net shorts all along, adding gradually. Currently net short 33.2k, up 3.2k.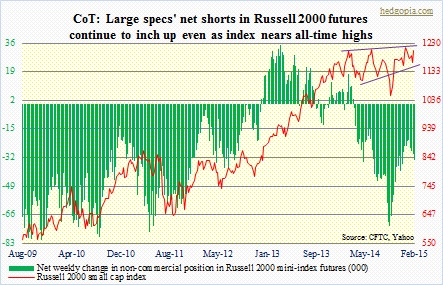
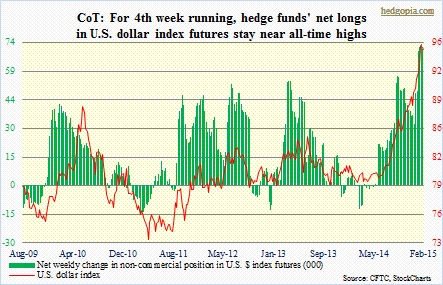
U.S. Dollar Index: Net longs have remained in the 70k range the past four weeks. The highest was 73.2k two weeks ago. Fatigue setting in? Too soon to say, but dollar bulls were tested a little this week. Shorter-term moving averages are beginning to hook down, and bulls cannot afford to lose that. Currently net long 71.6k, up 0.933k.
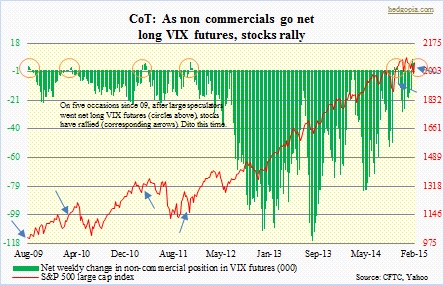
VIX: For five separate occasions since 2009 (indicated by orange circles in the chart), as large specs have gone net long VIX futures, stocks have rallied. Arrows correspond to where the S&P 500 stood at the time these traders went net long. Once again, they have been net long for three consecutive weeks. In the meantime, spot VIX has dropped from an intra-day high of 22.81 on Monday to 17.29. Currently net long 15k, up 10.6k.