The following are futures positions of non-commercials as of January 27 (Tuesday). Change is week-over-week.
10-year note: Can we say squeeze? Since the end of December, net shorts have dropped 59 percent, even as the 10-year yield has collapsed 50 basis points. That is in a month! The yield is yet to stabilize. Net shorts are still sizable for bond bulls to possibly squeeze these shorts. Currently non-commercials are net short 107.9k, down 37.7k w/w.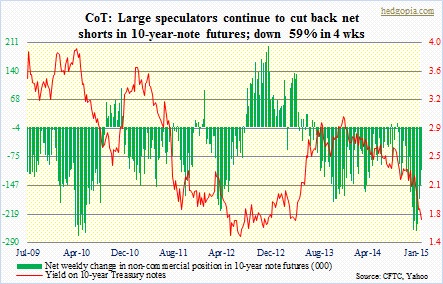
30-year bond: The 30-year yield made yet another low this week. As is the case with the 10-year, there is so far no sign of stability. These traders slightly added to their net shorts. Even though they have continued to maintain small net short exposure, percentage-wise, net shorts are down 71 percent from the high three weeks ago. Currently net short 10.1k, down 4.7k.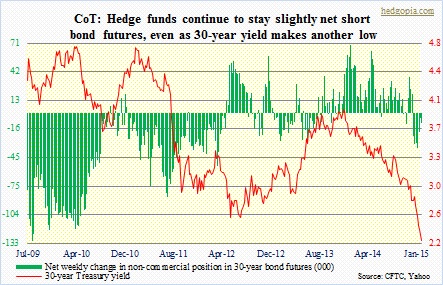
Crude oil: Net longs were reduced slightly but have been maintained in the 40k’s the past three weeks. The WTI rallied seven-plus percent on Friday after dropping to yet another low the day before. This thing is itching to go higher for now. Technicals are way too oversold. The way crude has broken, it is too soon to say this is THE bottom, but a bounce is due. Currently net long 41.8k, down 2k.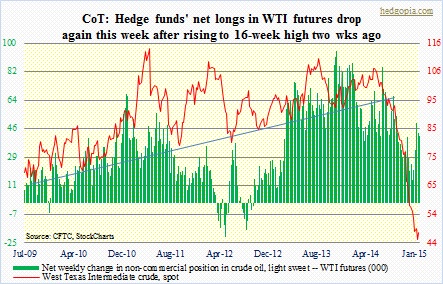
E-mini S&P 500: Net longs are essentially unchanged from last week, but versus three weeks ago have been cut back substantially. Bulls lost the crucial 2000, which had provided support several times. They need to retake the level as soon as possible, otherwise bears will take control. Already, there is a monthly MACD crossover. As well, January’s red candle follows a doji/spinning top in December. The 50-day moving average is beginning to curl down. Currently net long 77.3k, down 1.3k.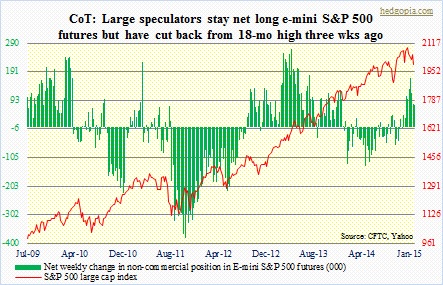
Euro: Net shorts are highest since mid-June 2012. The euro inched up a little for the week, and needs to show more signs of stability. Just to point out, a downtrend line drawn from the December 2004 high of 135 (FXE, which closed Friday at 111.22) extends to 105 to 110 (kind of a hurricane cone). Currently net short 184.7k, up 4k.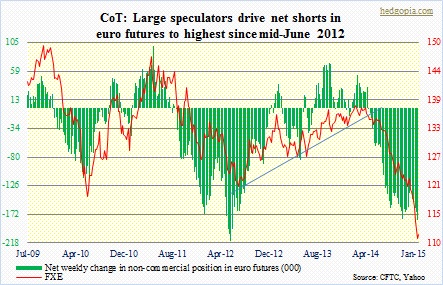
Gold: Net longs rose to highest since end-November 2012. Resistance (blue line in chart) held. The metal did retreat but ended the week essentially unchanged as it found support at its 200-day moving average. So it is kind of in no man’s land right now. In the near-term, gold probably breaks that 200-day support. Net longs currently 188.9k, up 26.5k.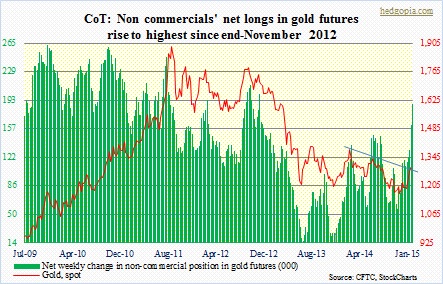
Nasdaq 100 index (mini): They have continued to cut back net longs. From the high seven weeks ago, they are now down 73 percent. The week’s rally attempt was repelled at resistance (blue line in chart). As is the case with the S&P 500, the 50-day is in the process of curling down on the Nasdaq 100. It cannot afford to lose 4100. Period. Currently net long 19.7k, down 8.9k.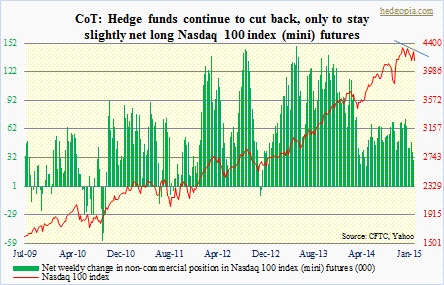
Russell 2000 mini-index: They have been gradually building net shorts the past three weeks. Positions are not huge compared to what they were leading up to the end-Sept 2014 high. Nonetheless, they seem to be in buildup mode. The Russell 2000 is caught in a wedge (looks a little different in a candlestick chart) and is approaching the bottom end (blue line). Odds are rising it falls out of that wedge. Should that happen, good luck to small-cap bulls! Currently net short 30k, up 2.2k.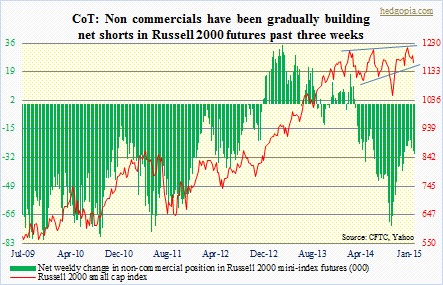
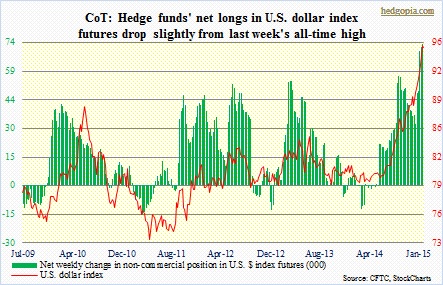
U.S. Dollar Index: Net longs were the highest ever last week. This week they dropped but ever so slightly – down 3.4 percent. January was the 7th consecutive up month, which is the first time since at least 1995. The currency is yet to catch its breath. It has been running and running. The U.S. dollar index is showing some early signs of reversal. Next week is likely to be crucial from this perspective. Currently net long 70.7k, down 2.5k.
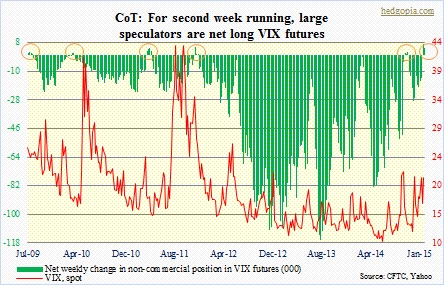
VIX: For second week running, they stayed net long. And that has been a good trade so far. The spot VIX was up 26 percent for the week. In the past, from the time large speculators went net long VIX futures (orange circle in chart), spot VIX in due course went lower, which by default meant higher stock prices (more on this, here). We will just have to wait and see if this plays out similarly this time around. Currently net long 4.4k, down 2.7k.