
Post-late December bottom, major US equity indices have rallied strongly to what could turn out to be strong resistance. Odds favor longs begin to lock in profit and/or shorts begin to get active.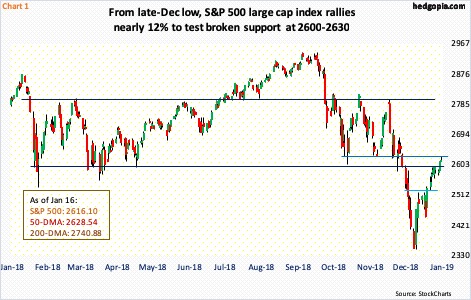
US stocks suffered quite a rout in October-December. Late December, they bottomed, followed by a strong rally in the past three weeks. They are beginning to give out signs of fatigue – right at/near crucial resistance.
For most of 2018, the S&P 500 large cap index (2616.10) went back and forth between 2800 and 2600. Mid-December, the latter was breached. Selling quickly picked up speed. Between the intraday all-time high of 2940.91 on September 21 and the low of 2346.58 on Boxing Day, the index shed 20.2 percent. A 50-percent retracement of this decline puts the index at 2644. Wednesday, it rose to 2625.76 before sellers showed up.
Wednesday’s high also just about kissed the 50-day moving average (2628.54). This is also where horizontal resistance lies (Chart 1). The daily chart in particular is grossly extended. In three weeks, the index is up just south of 12 percent. The temptation to lock in gains rises once the index begins to unwind its overbought condition.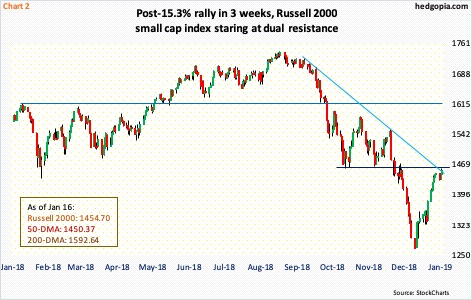
Small-caps are the same way. During the selloff, they were hit the hardest. From the intraday all-time high of 1742.09 on August 31 through the low of 1266.92 on Christmas Eve, the Russell 2000 small cap index collapsed 27.2 percent. Importantly, it peaked a lot earlier than its major peers.
On the way down, the Russell 2000 (1454.70) lost crucial support at 1600-plus, and 1450s after that (Chart 2). It is currently testing the latter breakdown. The 50-day (1450.37) lies right here. In fact, it feebly rallied past that average on Wednesday, but building on it right away likely proves difficult. The daily is deeply overbought. Plus, this is where a falling trend line from late September extends to.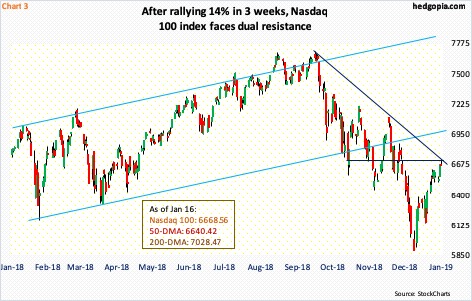
The Nasdaq 100 index (6668.56) faces similar resistance. It peaked intraday on October 1 at 7700.56, bottoming at 5895.12 on Christmas Eve, for a 23.4-percent drop. A 50-percent retracement of the decline lies at 6798. Wednesday’s high was 6720.40. Should it proceed to retrace 50 percent, it can rally another 1.9 percent. A retracement of similar magnitude on the Russell 2000 will similarly yield another 3.4-percent increase. In this scenario, both these indices will pull further away from their respective 50-day.
There is this, though.
The Nasdaq 100 retook that average (6640.42) on Tuesday. Come Wednesday, a shooting star showed up right above it. After having rallied 14 percent in three weeks, it is itching to digest the gains.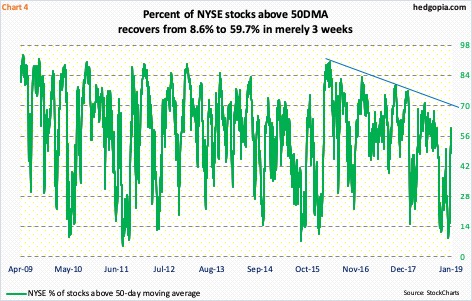
Concurrently, several other metrics that late December were at/near washout levels are no more. Chart 4 plots the percent of NYSE stocks above the 50-day. On December 24, it dropped to 8.6 percent – the lowest since August 2015. Wednesday, it stood at 59.7 percent.
Ideally, bulls would love to test the downtrend line from April 2016. Should this come to pass, as mentioned earlier, the Nasdaq 100 and the Russell 2000 could very well go on to retrace 50 percent – or thereabouts – of their respective decline. But it is equally possible things begin to weaken right here. Recent longs have built up nice gains in such a short period of time. The temptation to lock in profit increases as momentum decelerates at best and reverses at worst.
Thanks for reading!
