
The long-awaited liftoff is here. On Wednesday, the target range for the fed funds rate was raised to 0.25 percent to 0.5 percent – from the previous range of zero to 0.25 percent. This is the first hike since 2006; rates stayed zero-bound for seven years.
Either way you cut it, the move is historic. More so considering the Fed made the move in the face of data points that in the past have not coincided with the beginning of an interest ate tightening cycle.
This is not any other cycle. Thanks to seven years of ZIRP (zero interest rate policy), there is mispricing of assets, price discovering is missing. Signs of excesses abound.
The Fed moved alright, but the pace would be gradual and data-dependent – a point driven home by both the FOMC statement and Janet Yellen, Fed chair, in her post-FOMC press conference.
In light of this, the following three charts are worth a close look – they lend us some insight into the corner the Fed has painted itself into… and how aggressive it may or may not get come next year.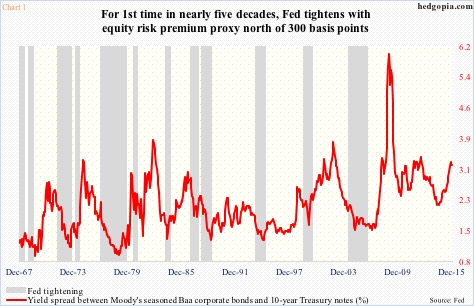
Chart 1 plots the yield spread between Moody’s Baa corporate bonds and 10-year Treasury notes with 12 tightening cycles going back to 1967. Currently, the spread is north of 300 basis points, and has been that way since August. Prior to Wednesday, the Fed has never tightened with the red line as wide as it is. The rate hike this week is setting precedent of sorts.
Capacity utilization in November dropped 0.7 percent month-over-month, to 76.95 percent. Year-over-year, it fell 2.6 percent – its seventh straight monthly decline. In the current cycle, utilization peaked at 79.04 percent a year ago, and has weakened since.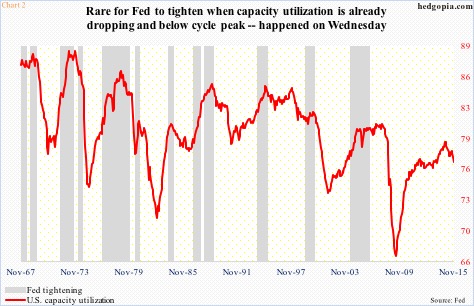
Once again, going back nearly five decades, it is not often the Fed begins to tighten when utilization is dropping from a cycle peak. In Chart 2, this took place in 1974, 1980 and 1999, with each of these years with its own unique characteristics. As relates to both 1974 and 1980, tightening had begun much earlier – 1972 and 1976, respectively. Inflation was a big problem back then, and Paul Volker was on the case. And 1999… well, the less said the better.
In each of the cases above, utilization was higher than what we have now – March 1974 (86.7 percent), August 1980 (77.9 percent), and June 1999 (81.3 percent).
On Wednesday, the Fed moved anyway.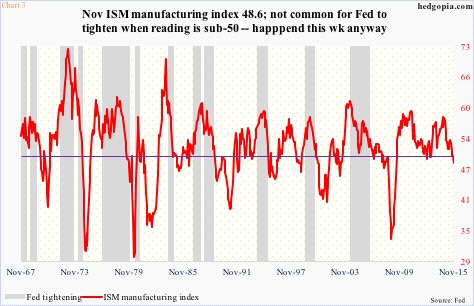
Lastly, the ISM manufacturing index dipped into contraction mode in November. The 48.6 reading was the first sub-50 reading in three years. In nearly five decades now, only once has the Fed tightened when manufacturing was contracting. That was August 1980, with different sets of circumstances. Mr. Volcker was trying to stomp out inflation. The tightening campaign had begun much earlier, with the fed funds rate rising 50 basis points to 10 percent in August 1980. Nothing like today, with rates near zero.
One look at the charts above, and it is easy to see why markets currently expect a shallow tightening cycle next year. In the futures market, traders currently expect two more hikes in 2016.
The Fed thinks otherwise. The dot plot continues to indicate four rate hikes next year.
Many times in the past, the Fed has been forced to bring its expectations in line with the markets’. Even in the current cycle, the bond market has consistently not been buying the central bank’s optimism – rightly so.
From this standpoint, it is only a matter of time before the Fed lowers its dot-plot projections.
Economic data continue to come in mixed. Inflation expectations are well-anchored. The recovery is into seventh year.
Here is the rub.
The maturity of the cycle is precisely the reason why the Fed may be trying – or need – to build its arsenal. Right now, its tool box is essentially empty. The sooner it fills its monetary quiver with arrows, the better equipped it will be to deal with the next downturn, which is not if but when.
In this scenario, a real tug of war lies between the Fed and market participants. The latter sooner or later may begin to throw a tantrum. And for a Fed that is sold into the efficacy of the wealth effect, that may be enough to revise the dot plot lower.
A tough spot to be in.
Thanks for reading!
Please keep in mind that this article was originally published yesterday (December 17th) by See It Market, where I am a contributor.
