
Last week, the major US equity indices rallied strongly – rising mid- to high-single digits. Bulls tried to maintain the momentum this week, but bears are coming out of the woodwork. Odds favor the latter right here and now.
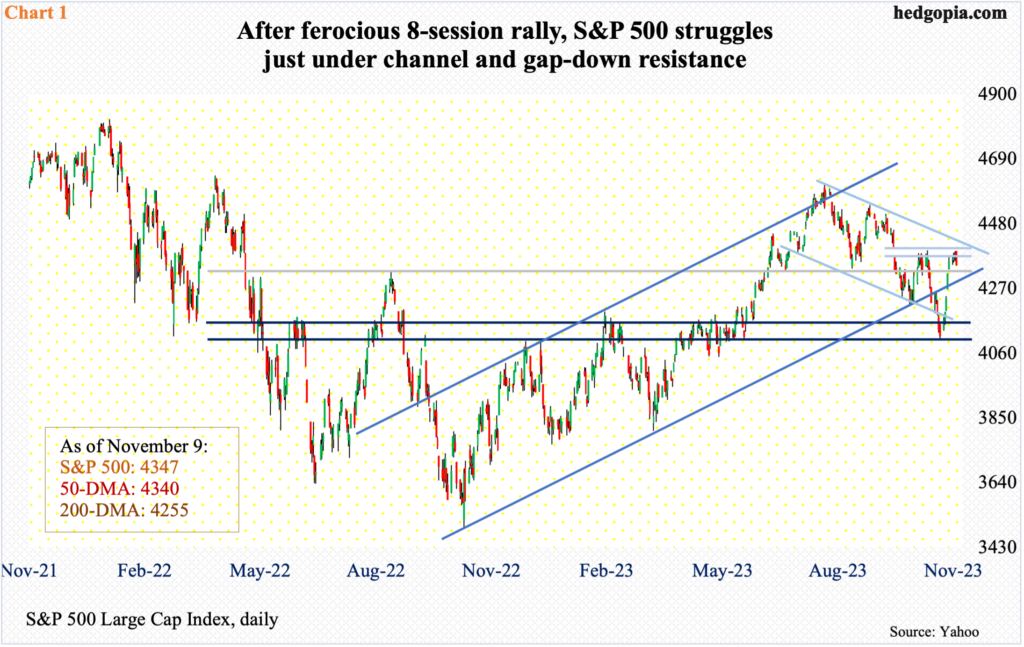
The S&P 500 shot up 5.9 percent last week to 4358, which more than offset the prior two weeks of decline – rallying back above both the 50- and 200-day moving averages as well as horizontal resistance at 4320s. Early on, the momentum continued this week. Through Wednesday’s intraday high of 4391, the large cap index added another 0.8 percent. Thursday, 4393 was tagged intraday but only to reverse hard lower to close down 0.8 percent to 4347. This confirms Wednesday’s dragonfly doji. Monday, too, formed the same candle but it was not confirmed.
Sellers showed up just under the upper trendline of a descending channel from July 27th when the S&P 500 turned back after touching 4607. Just north of 4400 also lies gap-down resistance from September 21st (Chart 1).
The daily is extended. Shorts have an opportunity here. The 50-day lies just underneath at 4340. After that lies the above-mentioned 4320s horizontal support. The hope for the bulls is that the selling stops around the 200-day (4255) – or a little lower at 4220s; should this occur, this can help form the right shoulder of a potential reverse-head-and-shoulders pattern, with the neckline at 4380s.
Tech bears, too, were quick to pounce on an opportunity.
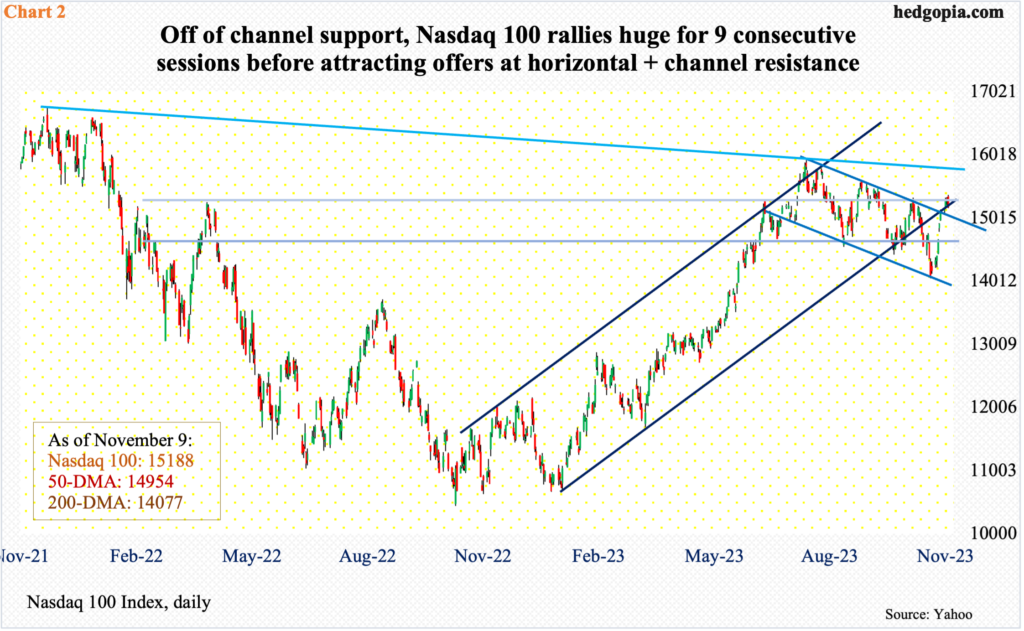
Last week, the Nasdaq 100 jumped 6.5 percent. Through Thursday’s intraday high of 15382, the tech-heavy index was up another 1.9 percent this week, but the bulls were unable to hold on to the gains, as the session finished lower 0.8 percent to 15188. This was the first down session in 10. This contrasts with the S&P 500’s eight straight up sessions. The Nasdaq 100 bottomed on October 26th – a day earlier than the S&P 500 – as bids showed up at the lower trendline of a descending channel from July 19th (Chart 2).
As a matter of fact, unlike the S&P 500, the Nasdaq 100 faintly broke out of that channel mid-week but failed to conquer lateral resistance at 15200s. As is the case with the S&P 500, Thursday’s action confirms Wednesday’s dragonfly doji on the Nasdaq 100.
The 50-day lies underneath at 14954. A gap-up on the 2nd this month gets filled at 14670s, even as the October 26th low of 14058 now lines up with the 200-day at 14077.
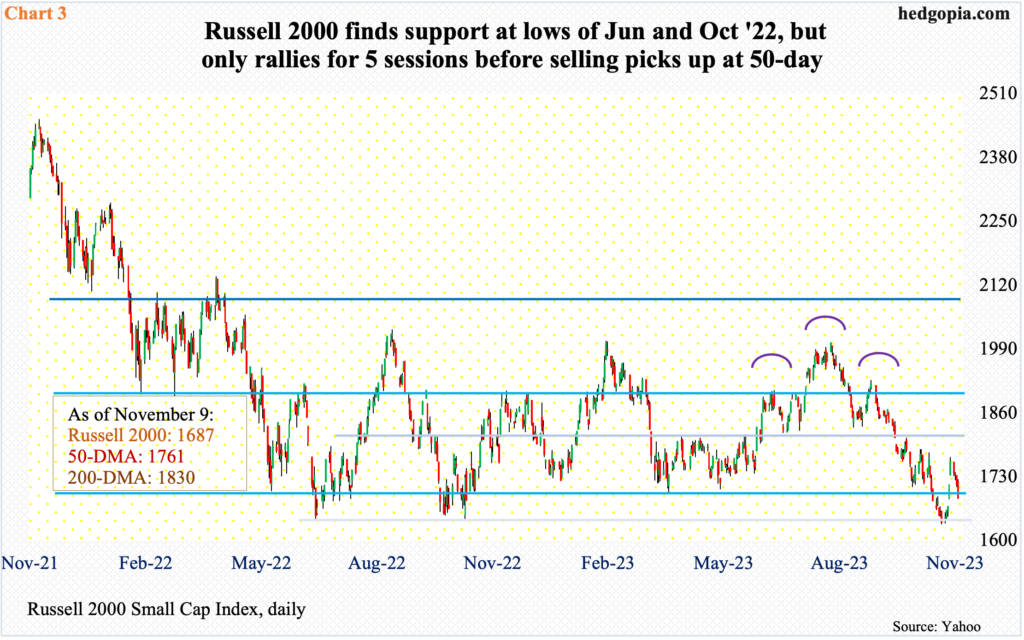
Throughout all this, small-caps fared poorly this week – relatively speaking. The Russell 2000 did surge 7.6 percent last week. For several sessions late last month and early this month, small-cap bulls successfully defended the lows of June and October last year at 1640s. But the follow-through has been anything but impressive.
Last week, the small cap index gapped up both Thursday and Friday, rallying for five sessions in a row. And that was it! Sellers already showed up Friday at the 50-day, and they continued to be in full control this week. The index dropped in all four sessions, closing Thursday at 1687. Ahead, inability to save 1640s will open the door toward 1600, which is where the currently-in-progress head-and-shoulders pattern, the neckline of which was broken on September 21st, will complete.
Thanks for reading!
