
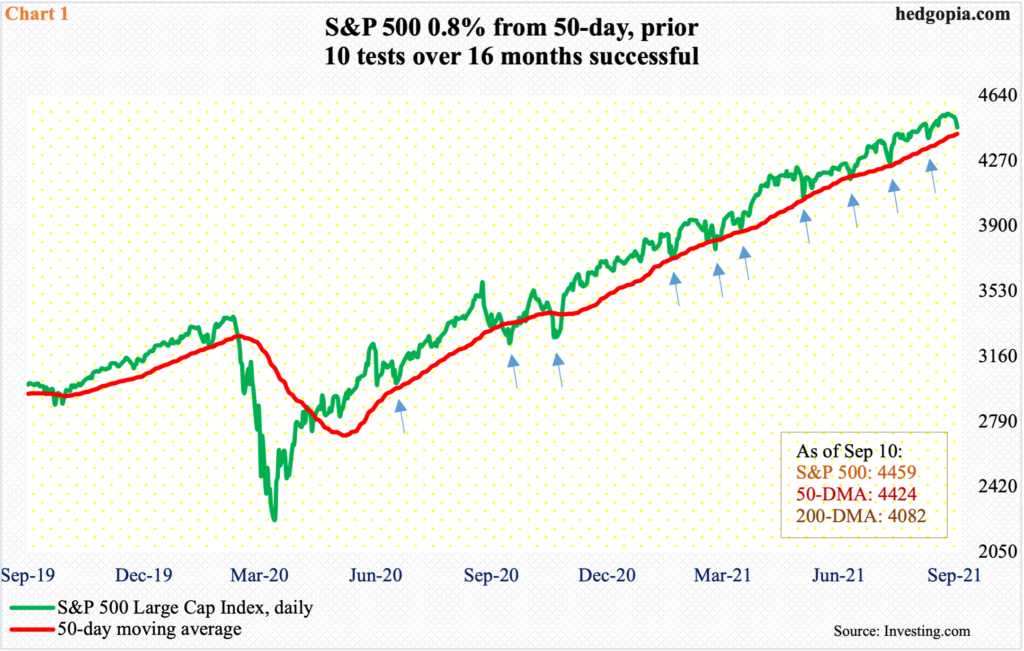
After dropping by a decent amount last week, major US equity indices are headed for a test of nearby support, which in the case of the S&P 500 is merely 0.8 percent away. Over the past 16 months, bulls’ mettle has been tested 10 times and they came through each time to save the 50-day. The imminent 11th test will be taking place in a seasonally tough September.
Before last week’s 1.7-percent drop, the S&P 500 remained extended on nearly all timeframes, including both weekly and monthly. The latter two have a ways to go before the overbought conditions they are in are unwound.
For that to even begin to happen, bears will first need to decisively reclaim the 50-day, which is 0.8 percent away. From May last year, there have been 10 successful tests of the average (Chart 1). The latest took place on August 19, after which the large cap index rallied 4.1 percent through its fresh all-time high of 4546 posted on the 2nd this month; the record was set in a doji session, followed by another doji on the 3rd. Then, last week, the index dropped in all four sessions, slicing through both the 10- and 20-day.
September has a reputation for being treacherous. It is possible traders for now simply decide to adopt a wait-and-see approach and not step up in defense of the 50-day. In the right circumstances for the bears, this can act as a self-fulfilling prophecy.
A likely breach of the 50-day exposes the S&P 500 (4459) to downside risk of 4360s.
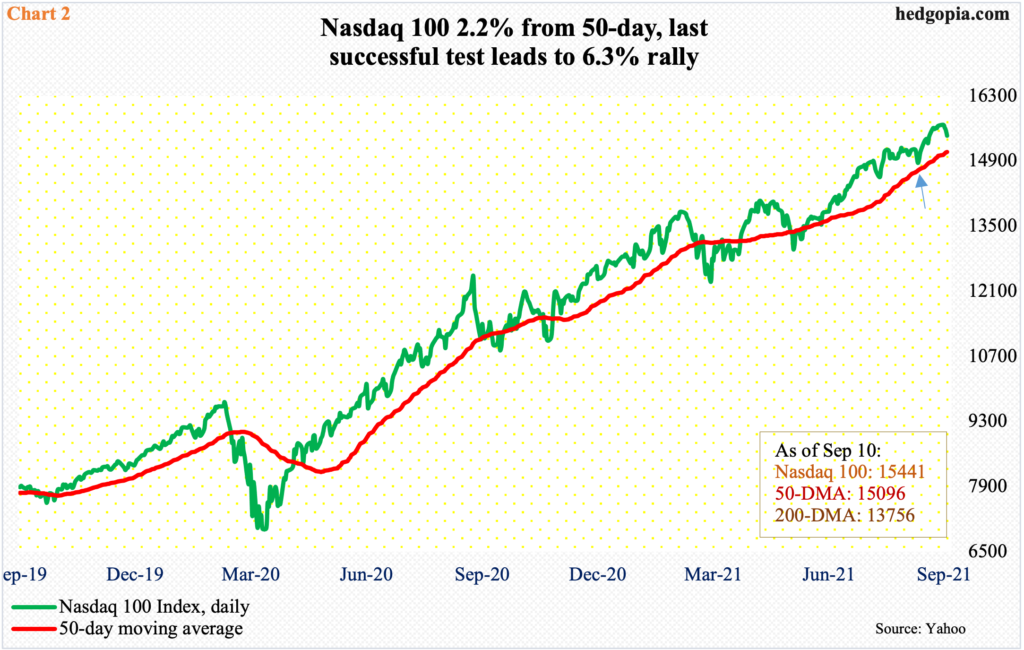
On the Nasdaq 100 (15441), the average is 2.2 percent away. Before Friday’s 0.8-percent decline, the tech-heavy index went sideways around 15700 for six sessions. Such setup could have easily resulted in a breakout – given that the preceding upward momentum was so strong. But Friday’s action has probably swung risk-reward odds in bears’ favor for now.
There is decent support at 15100s, which approximates the 50-day at 15096.
Only 16 sessions ago, the average was successfully tested (arrow in Chart 2), and from there the index rallied 6.3 percent through last Tuesday’s intraday high of 15701.
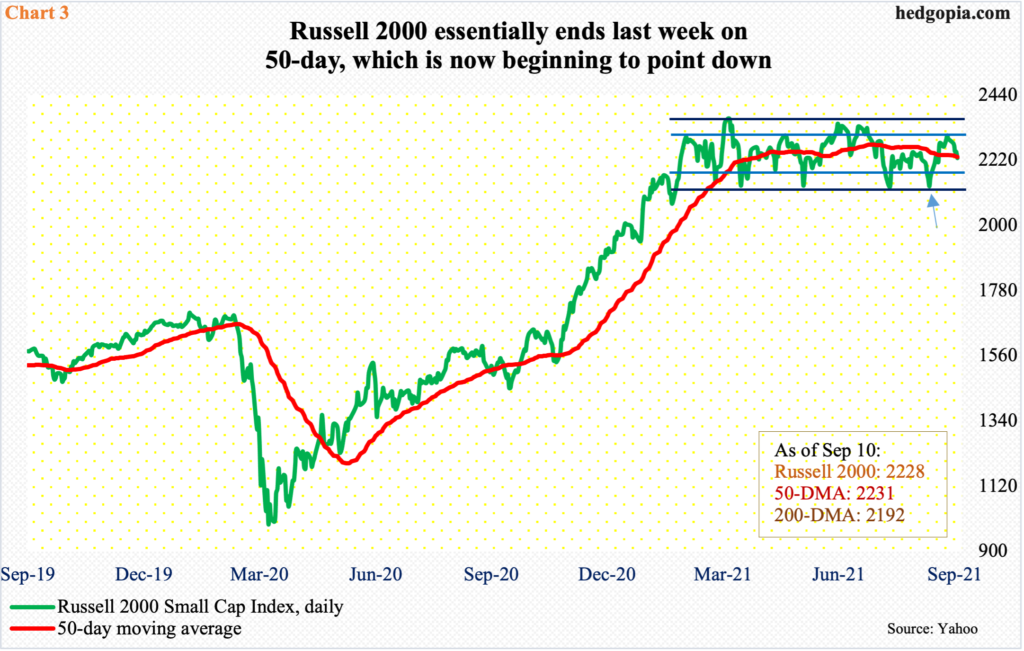
On both these indices, the 50-day is still rising. Bulls who swear by the importance of moving averages should like that. Things are not quite the same on the Russell 2000, which has gone sideways the past six months. The 50-day, too, has been flattish for that duration, and it is just now beginning to point down.
Beginning mid-March, the small cap index (2228) began to consolidate its one-year, 144-percent surge. As a result, it went back and forth within a rectangle, the upper bound of which lies at 2350s and the lower bound at 2080s.
Toward the middle of August, the lower bound was just about tested (arrow in Chart 3, which uses closing prices, so the levels identified slightly differ from one using candlestick). The rally that followed ended on the 2nd this month tagging 2310 – past 2080s – but the momentum did not last. Failure to capitalize on this run raises the odds of a test of 2150s, and even 2080s.
Next week is FOMC meeting – 6th this year. After this, two more remain. At the annual Jackson Hole symposium, Federal Reserve Chair Jerome Powell indicated that the central bank would begin to taper its bond purchases toward the end of this year.
Currently, the Fed buys up to $80 billion in treasury notes and bonds and $40 billion in mortgage-backed securities every month. Its assets have doubled since early March last year – from $4.24 trillion to $8.36 trillion.
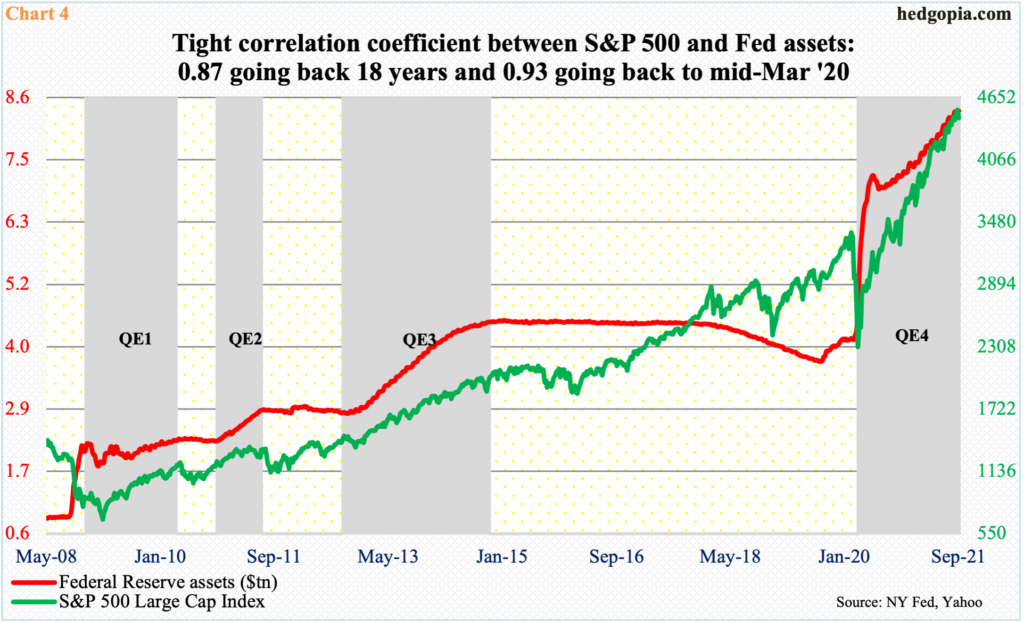
The persistent flow of liquidity has done wonders to equities, with a correlation coefficient of 0.93 going back to March last year (Chart 4). Going back 18 years, the correlation drops to 0.87 but is still very tight.
Traders hence are seemingly nervous ahead of the FOMC meeting. August’s weaker-than-expected job growth can push back the start of tapering by a month or two, but all signs are pointing to a start sooner than later.
As a matter of fact, it is very possible at least a section of the hitherto bulls has already either headed for the exits or reduced equity exposure.
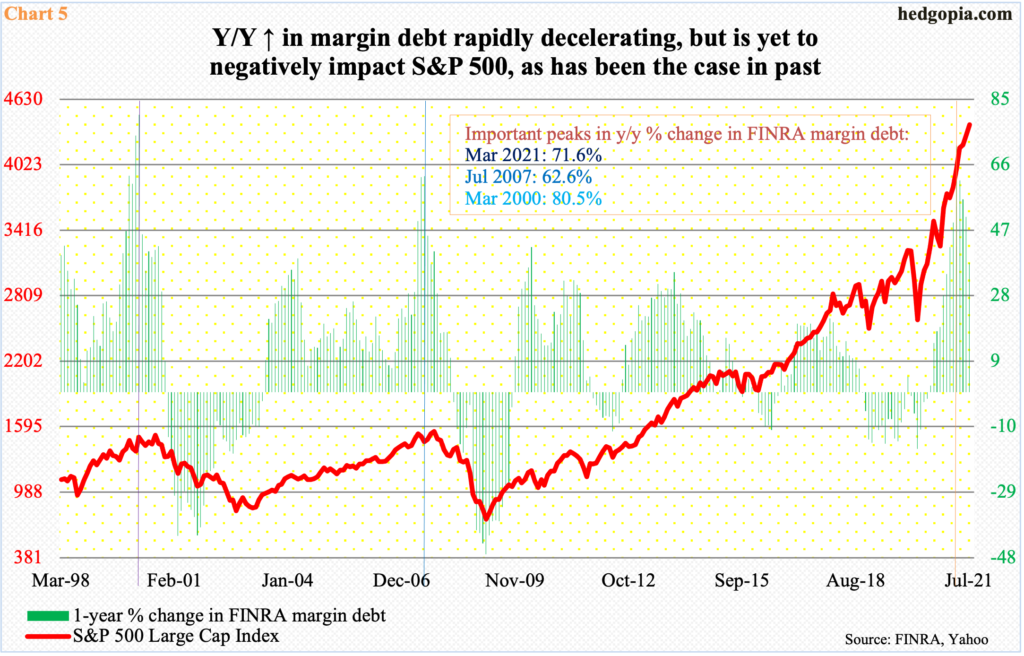
In July, FINRA margin debt dropped $37.8 billion from June’s record $882.1 billion. This was the first month-over-month decline since March last year, when margin debt reached a post-pandemic low of $479.3 billion. From that low, it surged 84 percent through June’s high. The S&P 500 bottomed at 2192 in March last year, rallying 107 percent through its high six sessions ago.
If past is prelude, margin debt’s year-over-year percent change is a good indicator to watch. When it gets excessive, it tends to reverse. In March, margin debt grew 71.6 percent y/y, versus prior peaks of 62.6 percent in July 2007 and 80.5 percent in March 2000 (Chart 5). The peaks in 2000 and 2007 eventually led to peaks in the S&P 500. This time around, it has not yet happened. Hence the significance of August’s data, which should be out soon.
Continued contraction in margin debt will not bode well for the bulls.
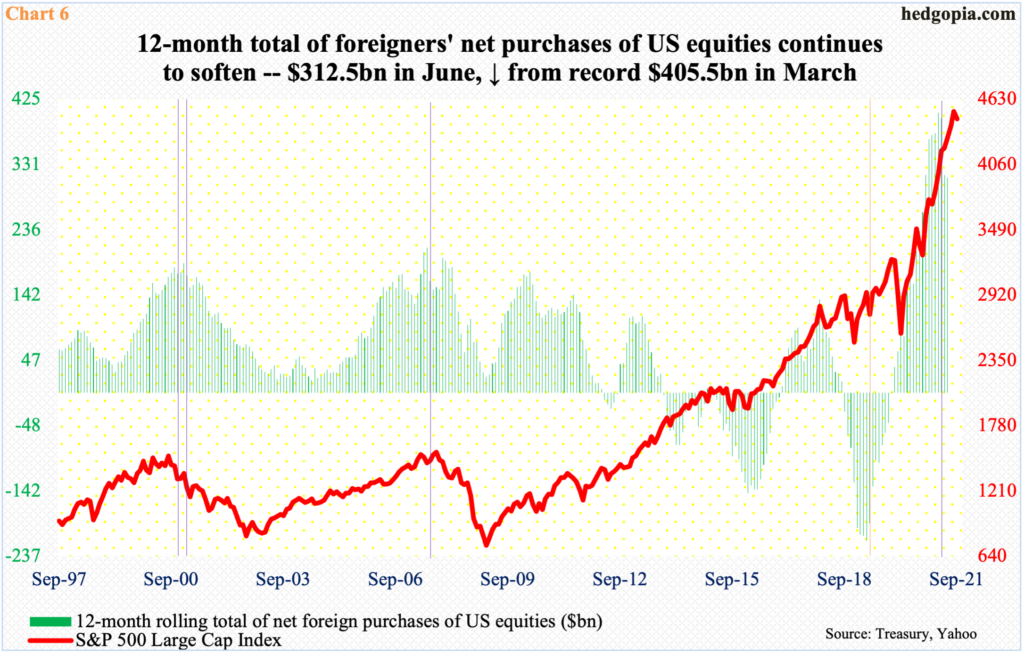
Then there are foreigners, whose US equity exposure is very high.
In the 12 months to April 2019, they sold $214.6 billion worth, which was a record (orange vertical line in Chart 6). They switched to net long in December that year and have not looked back since. In March this year, they were sitting on $405.5 billion – a record. Since that high, the 12-month total dropped m/m in April, May and June, although individually April and May were down but June was up. July’s data will be out this Thursday and will be telling.
As is the case with margin debt, continued contraction in foreigners’ love for US stocks should sooner or later reverberate through the S&P 500, and other major equity indices. Historically, the green bars and the red line in the chart have tended to move together.
Thanks for reading!
