
VIX last week breached late-December trendline support but remains above the important 200-day. Concurrently, after a massive rally off the March 30 low, which was probably aided by short-covering, the major equity indices ended last week right at/near important resistance.
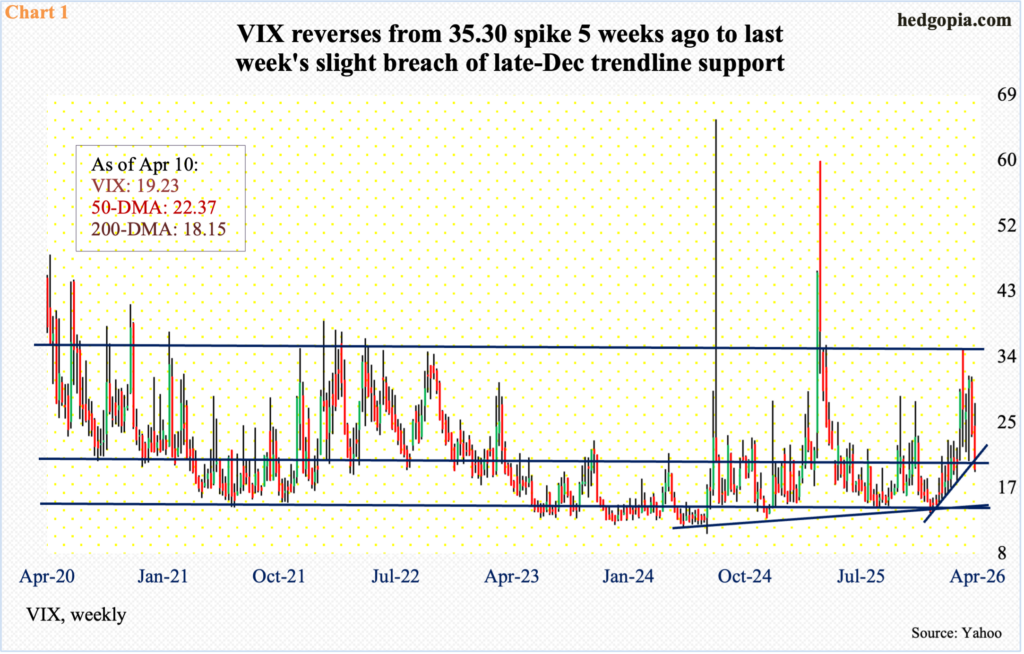
After a massive spike reversal on March 9 when VIX tagged 35.30 intraday but closed at 25.50, volatility has come under persistent pressure. It gave back 4.64 points last week to close at 19.23. Before shooting higher through the March 9 high, the volatility index ticked 17.50 on February 26 to find support just above the 200-day, with the average just about flat at 18.15 currently.
VIX, as a matter of fact, tagged 13.38 intraday on Christmas Eve before rallying all along a rising trendline thereof. That support was breached last week (Chart 1). VIX also dropped below the 50-day (22.37), but not the 200-day as mentioned earlier; a decisive loss of the latter can potentially boost prospects for volatility bears – and equity bulls by extension – but this scenario may not come to fruition given how the major equity indices are likely to behave in the sessions ahead.
Equities just enjoyed a massively profitable couple of weeks, which followed several weeks of downward pressure. Friday’s trading, however, has placed them at/near crucial resistance. This can attract selling, if nothing else just to unwind the daily overbought conditions.
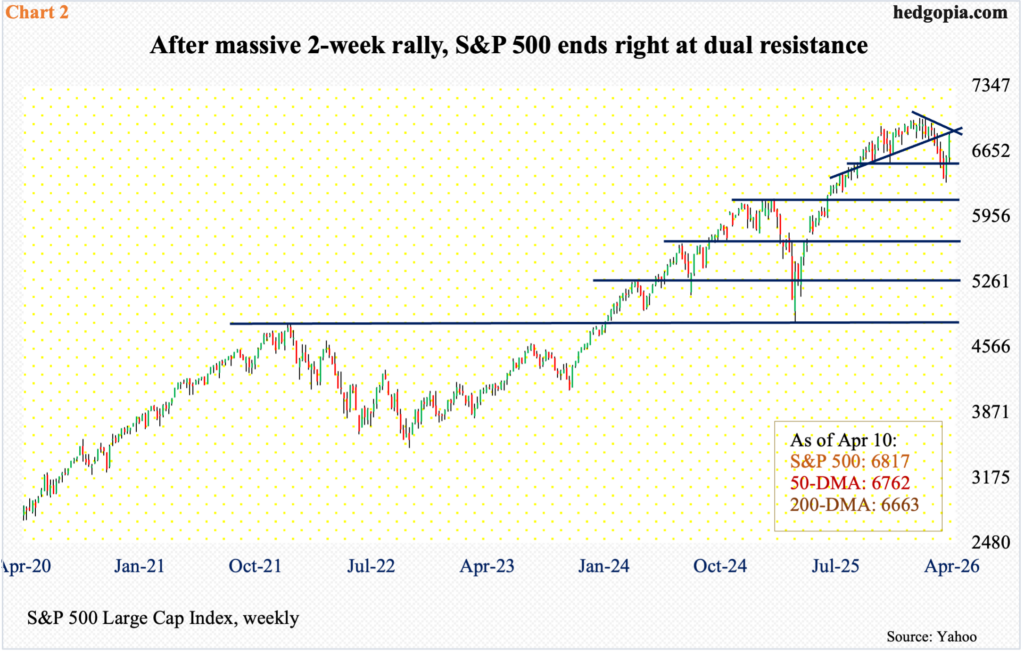
The S&P 500 rallied 3.6 percent last week and 3.4 percent in the week before, finishing at 6817. It earlier bottomed at 6317 on March 30, down 9.9 percent from the all-time high 7002 recorded on January 28.
Last week, bulls reclaimed both the 200- and 50-day (6663 and 6762 respectively), but they face quite a bit of resistance ahead. A falling trendline from the late-January peak was just about kissed intraday Friday as the large-cap index ticked 4846 (Chart 2); the session then ended in the red – albeit just by a tad. Friday’s high also kissed the underside of a broken trendline from last August. This dual resistance is unlikely to give way right away.
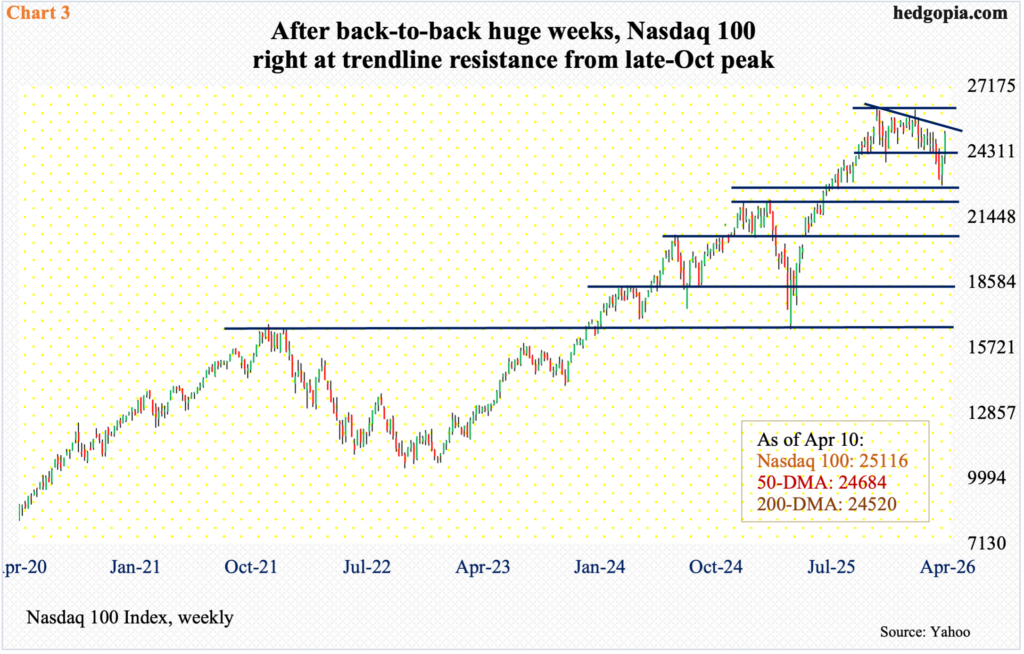
There is a similar hurdle on the Nasdaq 100, which between the intraday low of 22841 on March 30 and the all-time high 26182 recorded on October 29 tumbled 12.8 percent. It earlier bottomed at 16542 last April.
In the wake of that March 30 trough, the tech-heavy index rallied massively in the last two weeks – up 4.5 percent last week and up four percent in the week before, closing last week at 25116, with a high of 25226 on Friday, finishing above both the 50- and 200-day (24684 and 24520 respectively).
Friday’s high just about kissed a falling trendline from the October peak; on January 28, tech bulls were stopped 17 points short of that high (Chart 3). They are likely to meet with a similar fate at the trendline resistance they face currently.
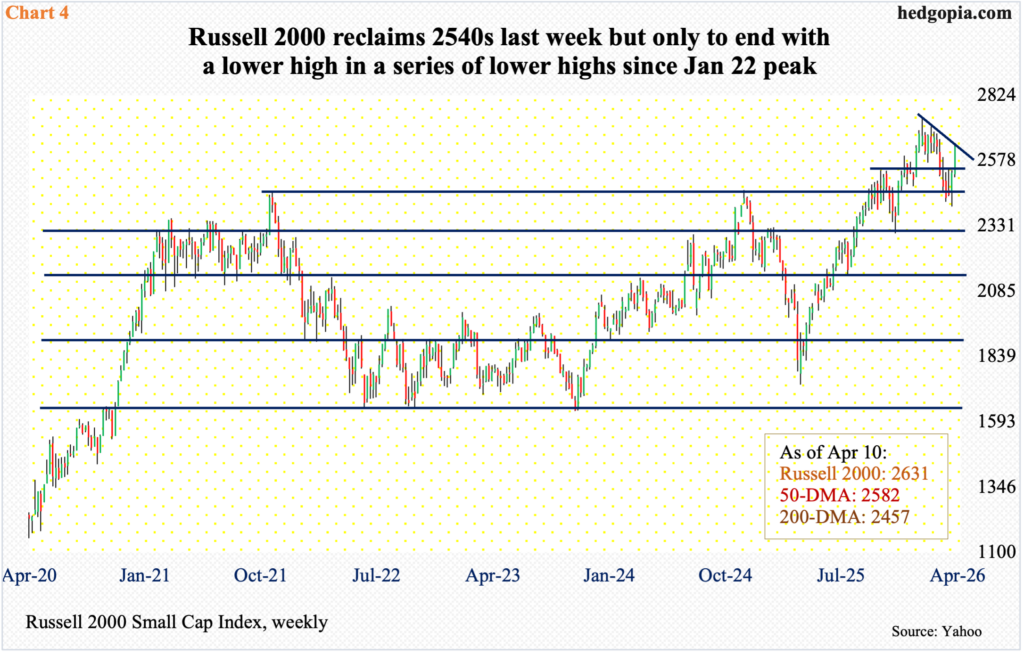
Over on the Russell 2000, things are evolving similarly. Small-cap bulls last week finally succeeded in taking care of stiff resistance at 2540s, which otherwise was proving impregnable for four successive weeks. Last week, the index jumped four percent to 2631, coming on the heels of gains of 3.3 percent in the prior week.
On March 30, the Russell 2000 bottomed at 2405, having peaked at 2735 on January 22. Once that high was put in place, the index then proceeded to make a series of lower highs, including last Thursday’s 2645 (Chart 4). As things stand, this resistance is likely to hold more than give way.
It is possible short-covering played quite a bit of role in the sharp two-week rally, as shorts were aggressively adding leading up to the late-March bottom.
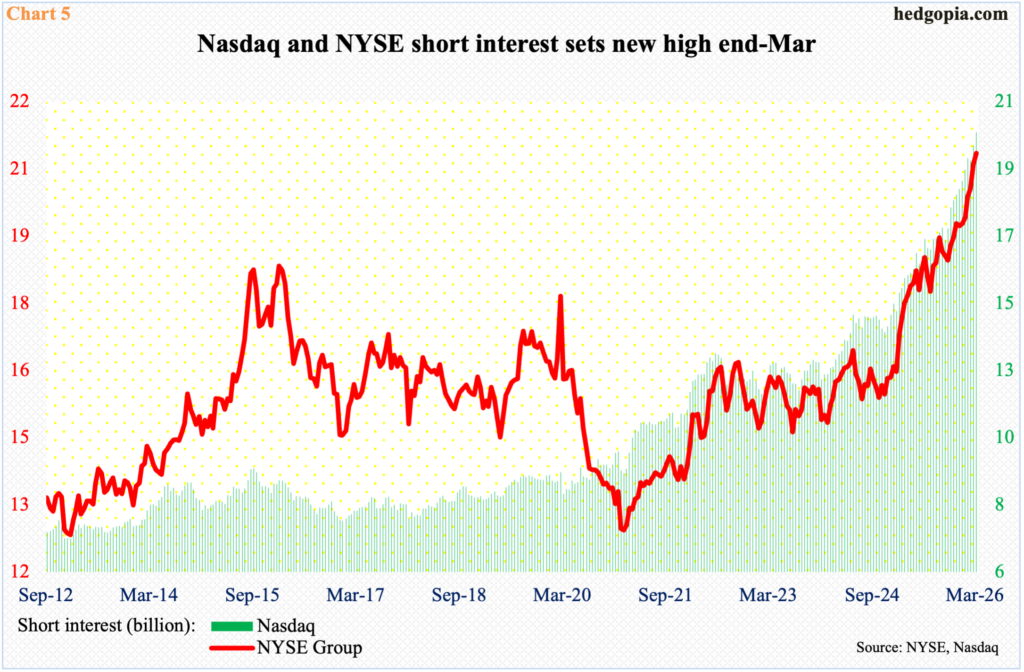
At the end of March, NYSE and Nasdaq short interest both set new highs, 2.09 billion and 2.04 billion, in that order (Chart 5); this year alone, these bearish bets are up eight percent and 9.9 percent respectively.
Short interest has trended higher for a while now. As the major indices bottomed last April, NYSE and Nasdaq short interest stood at 18.1 billion and 15.8 billion mid-April last year. The bears thus were on the receiving end as equities kept rallying until January. The most recent drop in these indices hence were probably used as an opportunity to cut losses; also, most recent shorts probably were in the green and saw it fit to lock in profit. This behavior must have contributed to the sharp two-week rally. Ideally for the bulls, more shorts could exit should the trendline resistance in question is broken to the upside, but odds of this happening right here and now are low given how overbought the daily conditions are.
Thanks for reading!
