
It is a top. But is this the top?
All of a sudden, it is not a crazy question to ask. The ferocity by which U.S. equities have dropped in recent sessions, one has to wonder if this marks a change in character. Right here and now, there is no definitive answer. More time is needed.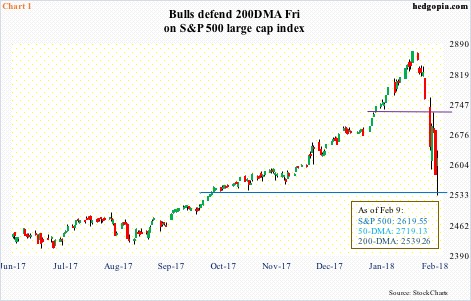
From the January 26th intraday high of 2872.87 through last Friday’s low of 2532.69, the S&P 500 large cap index collapsed 11.8 percent. That is in 11 sessions! Look at that waterfall drop on the right side of Chart 1.
This was of course preceded by massive surge in optimism.
At one point in January, the S&P 500 was up 7.5 percent. The monthly RSI was 89. Last week, Investors Intelligence bulls tumbled 11.6 percentage points week-over-week to 54.4 percent, but before that they remained 60 percent or higher for 17 weeks. And on and on.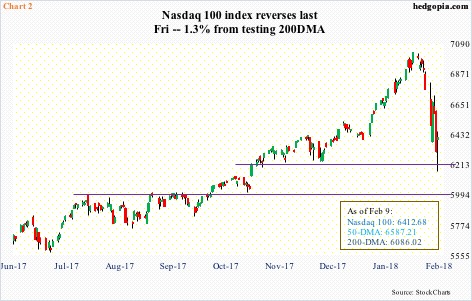
This was evident in other indices as well. The monthly RSI on the Nasdaq 100 had shot up to 86 – the highest since early 2000 – before peaking. In January alone, through the January 26th all-time high of 7022.97, the index jumped 9.8 percent.
From that high through the intraday low of 6164.43 last Friday, it declined 12.2 percent (Chart 2).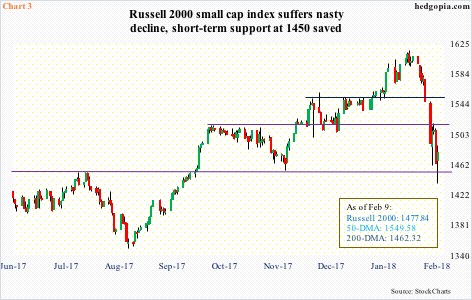
Rather revealingly perhaps, small-caps – supposedly the biggest beneficiary of reductions in U.S. corporate tax rates – hesitated to go along for the ride. The Russell 2000 small cap index rose, of course, but with less vigor. Through the January 24th (peaked two sessions before the large-caps did) high of 1615.52, it only rose 5.2 percent in January. Through last Friday’s low of 1436.43, it then dropped 11.1 percent (Chart 3).
Of major U.S. equity indices, the Russell 2000 was also the first to test the 200-day moving average, having done so last Tuesday, and then Thursday and again on Friday. Comparatively, the S&P 500 tested the average last Friday, even as the Nasdaq 100 came within 1.3 percent of doing so in that session.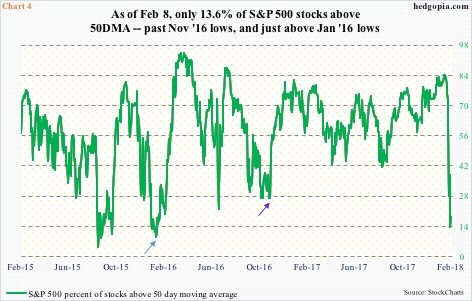
Odds favor a tradable bottom is in place. If nothing else just to unwind oversold conditions. The only question is of duration and magnitude.
Last Thursday, only 13.6 percent of S&P 500 stocks were above their 50-day. They peaked on January 23rd at 84.2 percent (Chart 4). Last week’s low undercut the lows of early November 2016 (just before the onset of the post-presidential election rally), and came within shouting distance of nine percent mid-January that year. Stocks reached a major bottom in January/February 2016.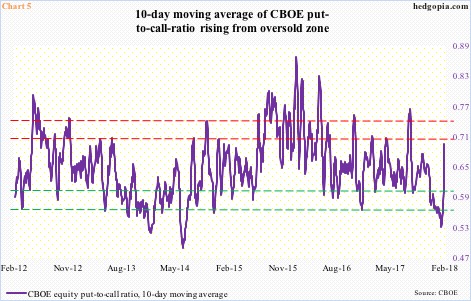
In the options market, last Friday did sense some panic out there. The CBOE equity put-to-call ratio rose to .88 – not high enough to declare the whites of bears’ eyes were seen, but high enough. This was the highest since .99 on November 2, 2016, and was preceded by five sessions of readings in high .60s and .70s.
Consequently, the 10-day average is rising. Earlier on the 26th last month, the violet line in Chart 5 dropped to .524, which was the lowest since .522 in July 2014. This once again points to the amount of optimism that was getting built in, and this was getting reflected in multiples.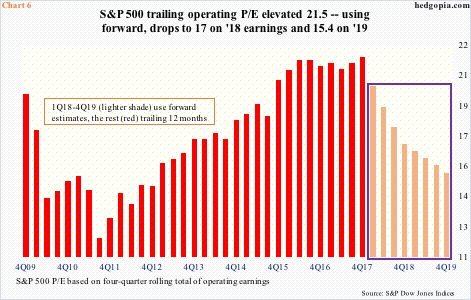
As of 4Q17, on a trailing 12-month basis, the S&P 500 traded at 21.5 times 2017 operating earnings of $124.13. This is expensive. But switch to forward earnings – which is what the majority uses – and valuations do not look as excessive, particularly so now that stocks have pulled back.
Using 2018 estimates of $154.39, the P/E ratio drops to 17, and further to 15.4 on the basis of 2019 estimates of $169.86 (Chart 6). At the lows last Friday, the S&P 500 sold for 16.4x 2018 and 14.9x 2019 earnings. This is no cheap by any stretch of the imagination, but relative to where things were versus just two weeks ago, multiples have improved, and may have led some to put a toe in the water.
Of course, the big question is if these estimates will come through. The trend the last several years tells us otherwise. In 1Q14, 2015 estimates were $137.19, versus actual earnings of $100.45. Similarly, 2016 estimates were $137.46 in 1Q15; when it was all said and done, $106.26 was earned. And 2017 expectations were $141.11 in 1Q16.
This time around, there is a new variable in the mix, which is tax cuts. And the sell-side could not wax more enthusiastic. Estimates for 2018 bottomed at $144.07 late October last year, and began to accelerate in the middle of January. Similarly, 2019 estimates were $160.03 in the first week of January.
Estimates have continued to get upwardly revised for the past several weeks, and there are lots of investors who focus on just that – upward earnings revision – before deciding to put money to work.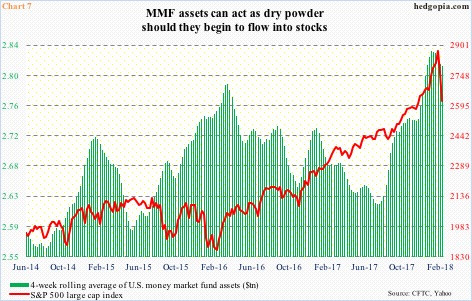
In the right circumstances, the dry powder of money market funds is there.
In the week ended December 27 last year, U.S. money-market-fund assets peaked at $2.85 trillion, then dropping to $2.82 trillion by January 27th. Some of this did get deployed as stocks took off in January. As of Wednesday last week, they were $2.83 trillion.
Chart 7 presents these assets on a four-week rolling average basis. The green bars peaked at $2.84 trillion early January, dropping to $2.82 trillion in the latest week. If the trend persists, there is plenty of room for these assets to continue lower.
But just because there is dry powder does not mean it will flow into stocks. It may even flow into bonds as 10-year yields (2.83 percent) are beginning to give out signs of fatigue.
In the case of the S&P 500, in an optimistic scenario, it could (1) rally straight into the 50-day (2719.13) and reverse (2) rally into the 50-day and beyond, (3) go back and forth above the 200-day and build a base.
At times like this, hypothetically, selling puts to at least earn some premium and/or position oneself to go long at last week’s lows is not a bad idea.
SPY (SPDR S&P 500 ETF) closed last week at $261.50, with the weekly low of $252.92 and the 200-day at $253.67. Weekly (February 16th) 256 puts bring in $2.80. If put, it is a long at $253.20.
Thanks for reading!
