
The S&P 500 trades at elevated multiples. Earnings expectations for this year and next are very high. Enter macro uncertainty surrounding the fiscal/tariff policy of the Trump administration. Consumer sentiment has tumbled in recent months, and there are signs of deceleration in the economy. It will be hard for equity bulls to repeat last two years’ 20-plus-percent gains. Near-term is another matter. A relief rally is due.

Stocks took a breather last month. February’s 1.4-percent slide in the S&P 500 follows gains of 2.7 percent in January. With two months in, 2025 is up 1.2 percent. This comes on the heels a blockbuster performance in both 2024 and 2023, with rallies of 23.3 percent and 24.2 percent respectively.
This obviously has pushed up multiples. On a 12-month trailing basis, the S&P 500 finished the September quarter at 25.5 times operating earnings. In the December quarter, this nudged lower to 25.2x (Chart 1). Historically, these are very expensive multiples.
As things stand, the sell-side expects these companies to ring up $267.35 this year and $306.73 next. In 2024, earnings grew 9.5 percent to $233.82. If these analysts’ optimism for this year and next comes true, earnings growth will have accelerated to 14.3 percent this year and 14.7 percent next year.
Even at this level of earnings, the current price-to-earnings multiple is at 22.3x and 19.4x for this year and next, in that order. Even going out to 2026, valuations are hardly cheap. Besides, the current revision trend is down. In March 2023, the sell-side was penciling in $246.31 for 2024. Last July, 2025 estimates were $277.86, and at the end of this January, 2026 estimates were $310.02.
These earnings expectations are particularly suspect as the economy, which looks strong now, is at risk of downside surprise in the quarters to come as businesses and consumers pull back in the face of rising uncertainty.
No matter how the Trump administration spins it, tariffs, which are paid by the importing side, will probably increase the prices consumers pay. For that not to happen, either the exporters will have to agree to lower their prices by a like amount or the importers take a hit on margins by keeping the prices constant. In the absence of that, prices will go up. Yes, because this is one time (unless tariffs keep rising in a tit-for-tat game), this is not likely to result in persistent increase in inflation, but the fact remains that the prices will settle at a higher level accounting for a larger share of consumers’ income.
Consumers’ worry is getting reflected in sentiment surveys. The University of Michigan’s consumer sentiment index ended December at 74 and was 64.7 at the end of last month – a 15-month low. In recent weeks, signs are showing up of a weakening macro environment. In January, personal income rose 0.9 percent, while spending fell 0.2 percent. Rates on the long end of the curve are beginning to reflect this.
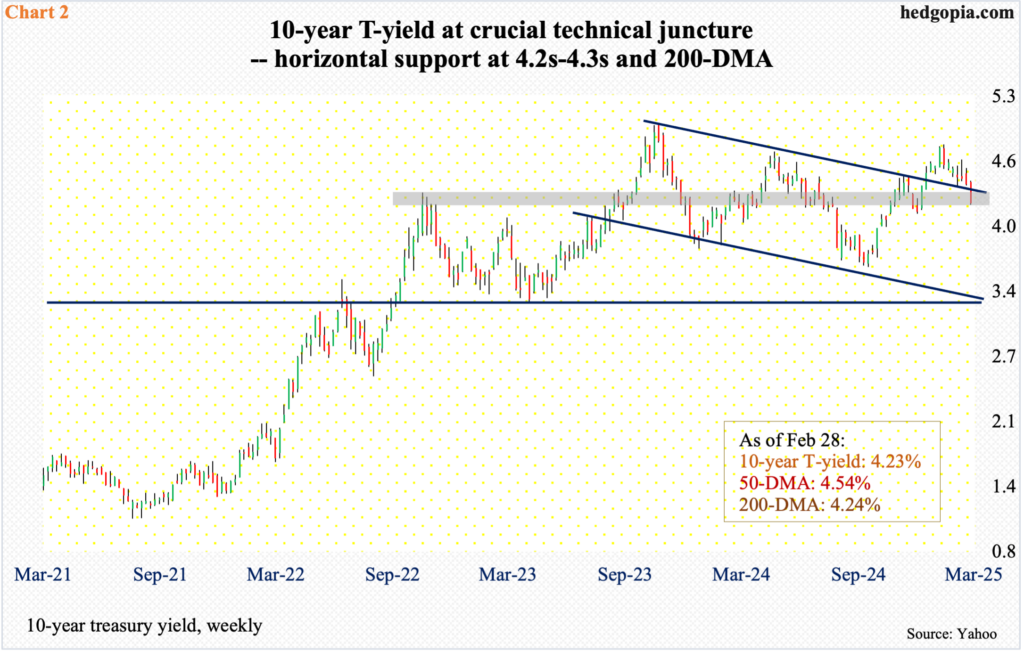
The 10-year treasury yield hit 4.81 percent on January 14 and finished last week at 4.23 percent, down 19 basis points week-over-week. Yields are at a crucial technical level currently. The 200-day moving average lies at 4.24 percent. Plus, horizontal support at 4.2s-4.3s goes back years (Chart 2). A breach here has the potential to take out stops and put more downward pressure on these rates.
It is now becoming clearer why small-caps, which inherently have more domestic exposure than their large-cap cousins, have not been able to get going even as the large-caps kept rallying to new highs.
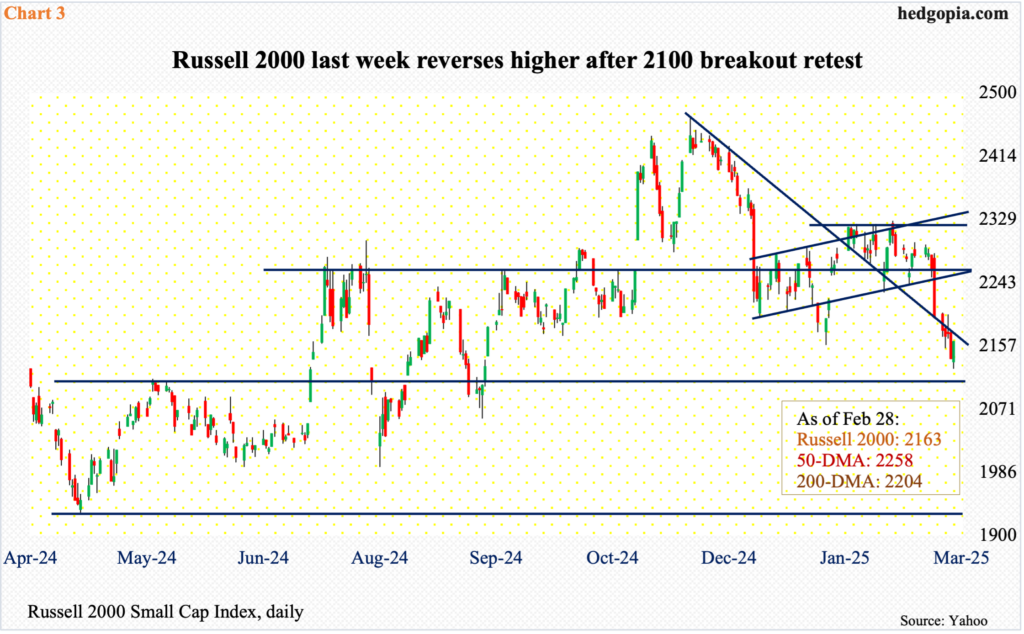
Last November, the Russell 2000 posted a new all-time high of 2466 on November 25 – just past the prior high of 2459 from November 2021 – before heading lower. Last Friday, it ticked 2126 intraday, closing at 2163, with the week finishing lower 1.5 percent.
The small cap index broke out of 2100 last July, with a successful retest in September. Last week’s test – just about – has the potential to be a successful one as well (Chart 3). For now.
Most recently, the small cap index was repelled at 2320s repeatedly. Before the bulls could go after this, they are likely to face resistance at 2200 and then 2260s, with the latter going back to mid-July last year.
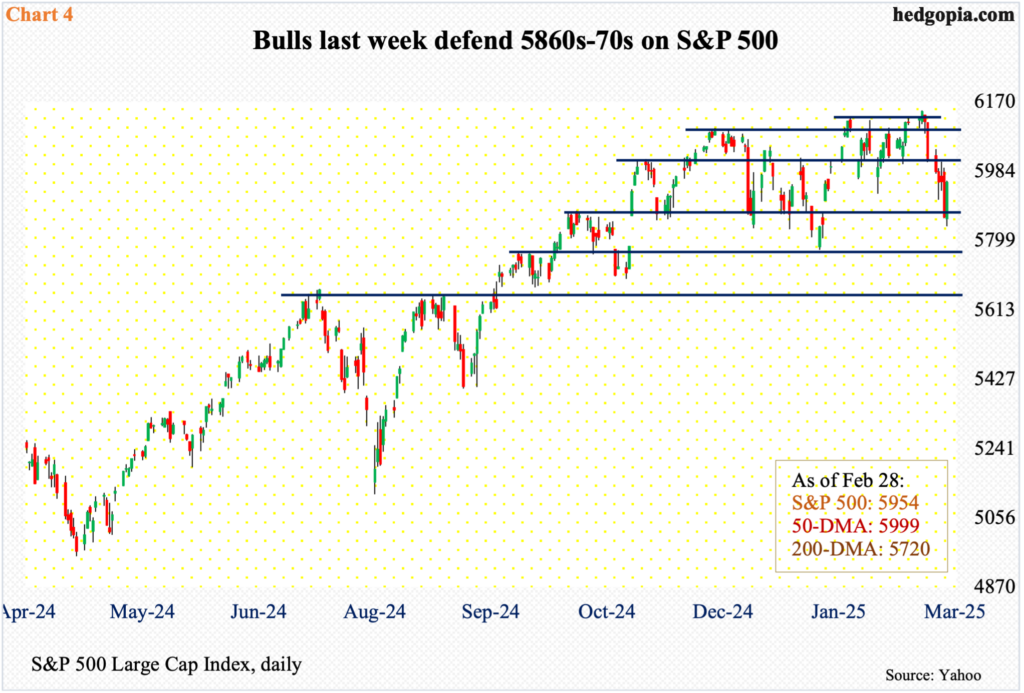
Large-caps such as the S&P 500 are performing much better, but even here, the index has come under pressure since rising to a new intraday high of 6147 on the 19th last month.
The large cap index began last week by losing the 50-day, with the bulls seeking to reclaim the average in the next three sessions but only to get overpowered by the bears on Thursday. The downward momentum continued early on Friday, but only for bids to show up just under crucial support. The index dropped as low as 5838 Friday. In the end, horizontal support at 5870s was defended (Chart 4). This gives the bulls an opportunity to go after the 50-day (5999) – now pointing down – which also lines up with straight-line resistance at 6000. If this resistance holds, the next layer of support is not until 5770s. The 200-day – still rising – rests at 5720.
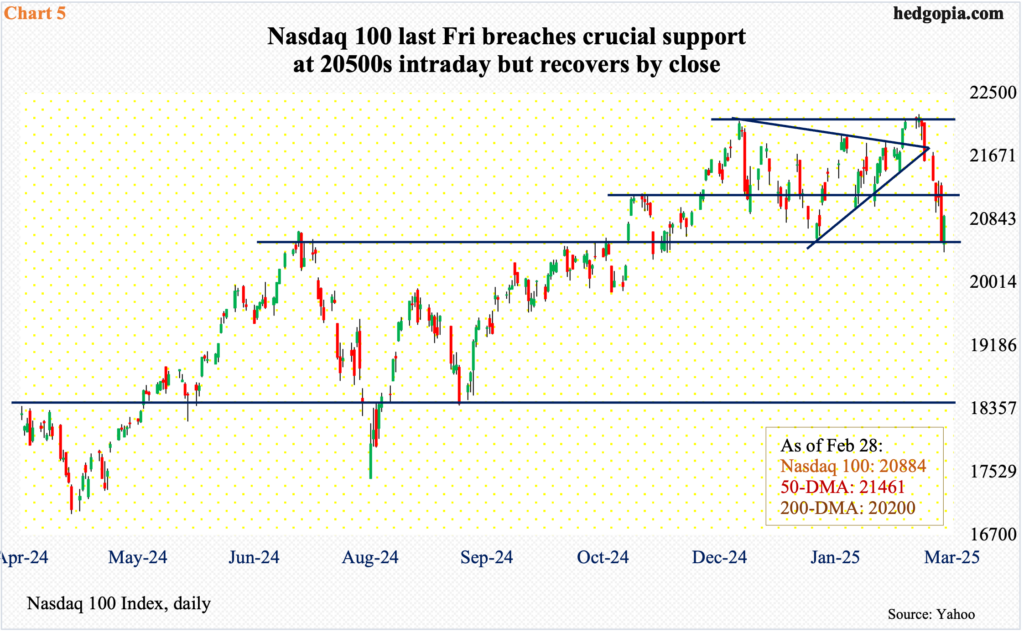
In essence, elevated multiples amid loads of macro/policy uncertainty make things increasingly difficult for the bulls to repeat last two years’ feat, but near-term is another matter. This also holds true for the Nasdaq 100, which too printed a new intraday high of 22223 on the 19th and then reversed lower.
Last week, the tech-heavy index was punished for a drawdown of 3.4 percent to 20884. Nvidia’s (NVDA) January-quarter results were better than expected but received very poorly in the markets, with the stock down 8.5 percent on Thursday post-earnings.
The good thing from the bulls’ perspective is that Friday’s intraday low of 20407 drew buying interest. Horizontal support at 20500s was defended (Chart 5). This occurred just above the 200-day at 20200. For now, tech bulls must at least be eyeing the declining 50-day at 21461.
Thanks for reading!
