
The dichotomy between large- and small-caps continues – the former at 14-month high and the latter stuck in an 18-month range. That said, the S&P 500 has reached a potentially crucial resistance. Buybacks have been providing a nice tailwind. Margin debt is beginning to rise from the December 2022 low. But fund flows – although encouraging last week – remain a question mark.
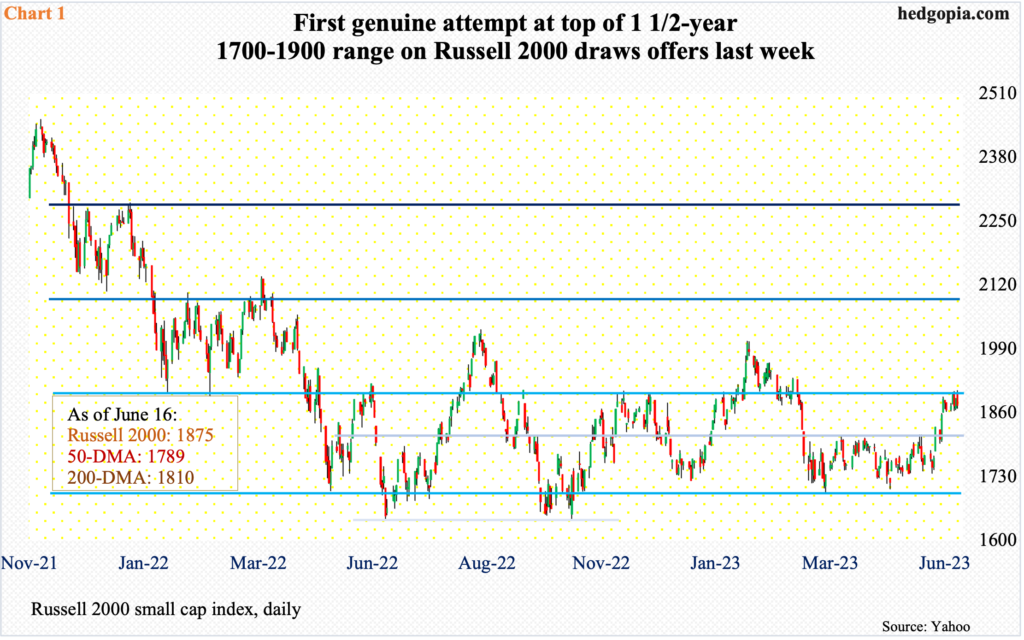
Yet again, small-cap bears denied bulls an opportunity to break out of a one-and-a-half-year range. The Russell 2000 has been going back and forth between 1700 and 1900 since January last year (Chart 1). Horizontal support at 1700, in fact, goes back to August 2018.
The small cap index lost 1900 in early March this year and had not tested the level since – until last week. In three session last week, 1900 was reclaimed intraday but only to get pushed back below by close. When it was all said and done, the Russell 2000 rallied 0.5 percent last week to 1875 – significantly underperforming versus the S&P 500’s 2.6 percent and the Nasdaq 100’s 3.8 percent.
Rather revealingly, the Russell 2000 failed to break out last week, even as both the S&P 500 and the Nasdaq 100 were able to push through levels that had acted as roadblocks for a while.
Odds favor the Russell 2000 will now be forced to defend 1800 – the mid-point of the range.
Large-caps, in contrast, are acting a lot better.
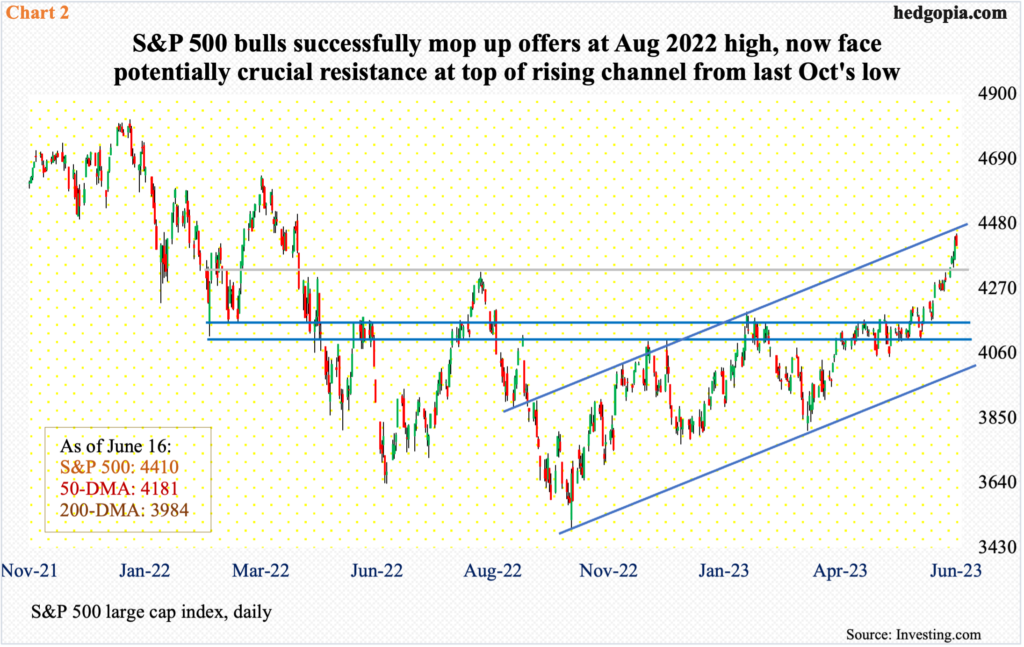
In the week before, the S&P 500 did hesitate at last August’s high tagging 4323 intra-week; back then, the large cap index ticked 4325 before resuming a downtrend that began in January last year, subsequently bottoming at 3492 in October.
Last week, there was no hesitancy. The index opened the week strong and kept rallying. By Thursday, the S&P 500 was up six sessions in a row. The momentum continued Friday, touching 4448 intraday but only to then weaken to close the week out at 4410, still up a robust 2.6 percent for the week. From last October’s low through Friday’s high, the S&P 500 jumped 27.4 percent.
The index has also rallied within an ascending channel from that low (Chart 2). Friday’s high just about kissed the upper end. The test is taking place at a time when the index is extremely overbought. It has now rallied for five straight weeks, with the daily RSI solidly into the low-70s in all of last week; at 68.28, the weekly RSI is just short of the 70 mark. Bulls would love for momentum to continue and for the weekly RSI to at least enter the 70s.
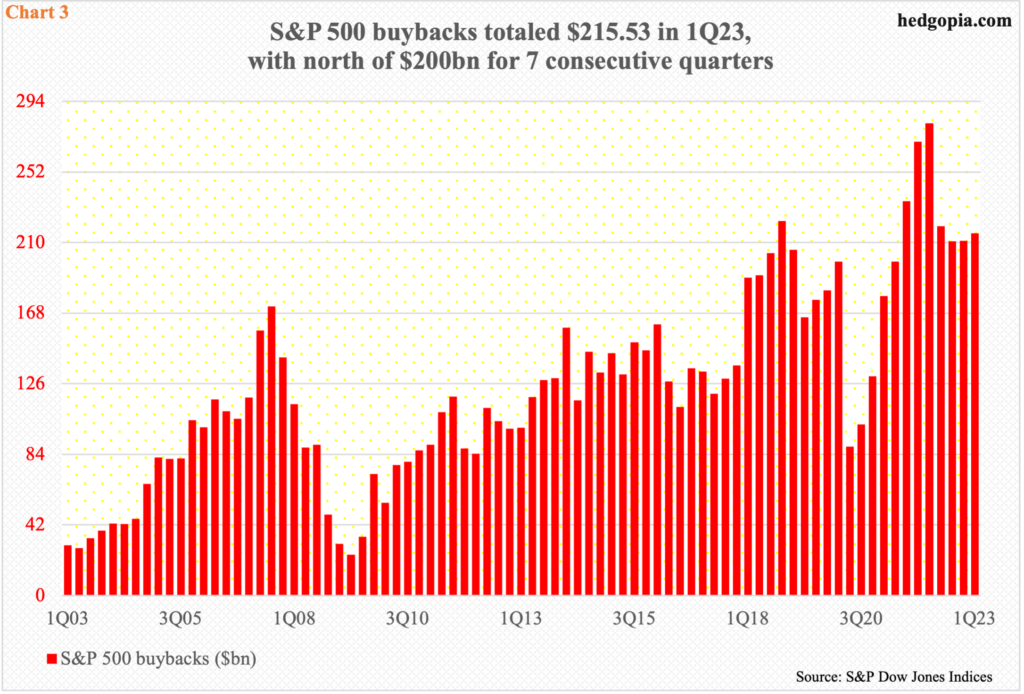
One thing equity bulls have consistently had the support of in recent years is corporate buybacks.
In the first quarter, S&P 500 companies spent $216 billion in buybacks. (By the way, they paid out $147 billion in dividends. The combined total of buybacks and dividends accounted for nearly 83 percent of $439 billion in operating earnings.)
This was the seventh quarter in a row that quarterly buybacks exceeded $200 billion. Post-pandemic, buybacks briefly fell below $100 billion in 2Q20 when companies spent $89 billion, before they gradually recovered, reaching a new all-time high of $281 billion in 1Q22 (Chart 3).
On a four-quarter rolling total basis, buybacks were $857 billion in 1Q23 – a six-quarter low. They peaked at $1,005 billion in 2Q22 and has dropped every quarter since.
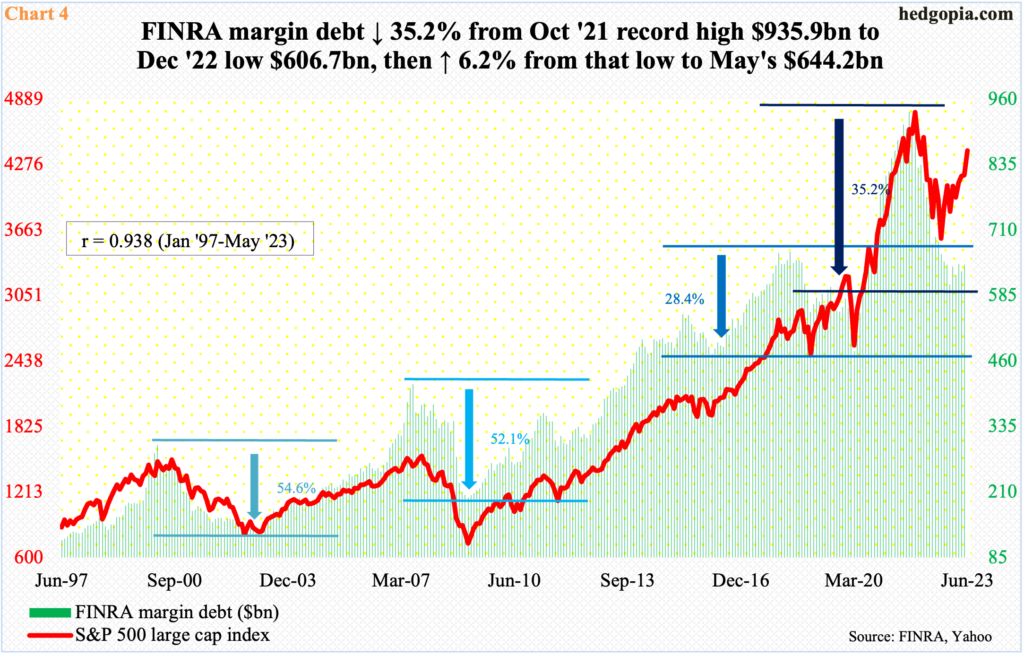
There was a time margin debt provided a similar tailwind. In March 2020, it hit a four-year low of $479 billion. It then surged more than 95 percent to $936 billion by October 2021, which set a new record. The S&P 500 peaked in the following January, even as both the Nasdaq 100 and the Russell 2000 peaked in November that same year.
From the October 2021 peak through December 2022, margin debt declined 35.2 percent to $607 billion, before edging higher. The drop was not as severe as the March 2000-September 2002 and July 2007-February 2009 contractions in particular – with peak-to-trough drops of 50-plus percent (Chart 4). Nevertheless, from the December trough through May’s $644 billion, margin debt has gone up 6.2 percent. This is a small contribution to equity bulls’ cause, yet from the October 2022 bottom in stocks, margin debt has essentially gone sideways, as it was $650 billion back then.
Depending on one’s bias, this can be viewed both positively and negatively. Bears’ contention is that the inability of the rally so far to coax more leverage-taking in and of itself is a sign that the rally is not based on solid ground, while bulls argue that this suggests there is room for margin debt to rise and help push stocks higher. Regardless, the probability is low, but if bulls turn out to be right, then margin debt will only help in the months to come.
The same can be said of fund flows.
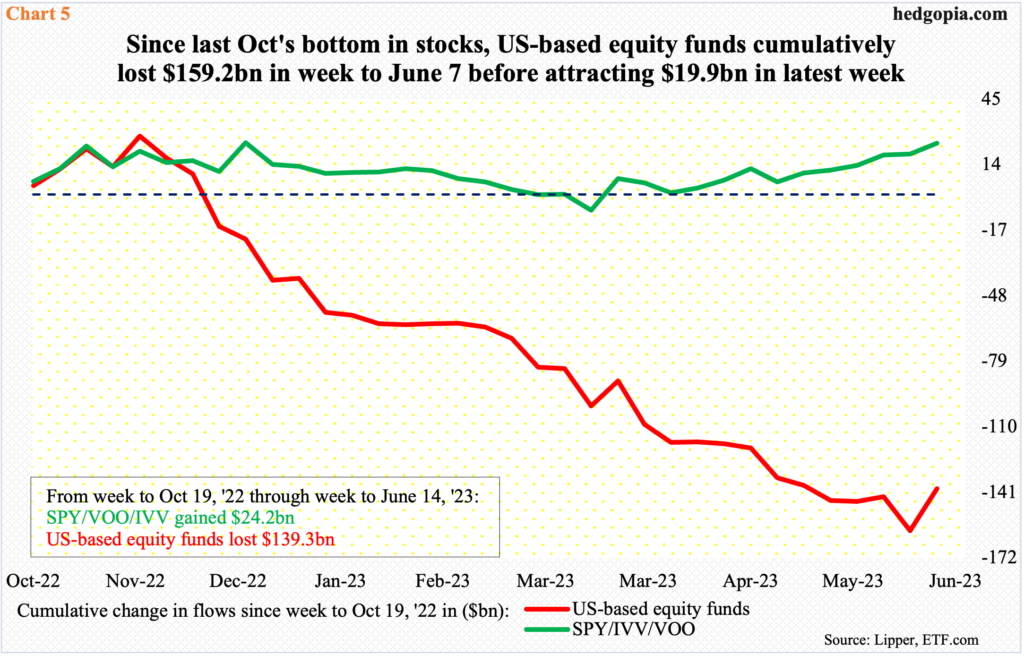
Chart 5 tallies flows into US-based equity funds plus three S&P 500-focused ETFs – SPY (SPDR S&P 500 ETF), VOO (Vanguard S&P 500 ETF) and IVV (iShares Core S&P 500 ETF) from the start of last October’s bottom in stocks.
Through the week to last Wednesday, the three ETFs cumulatively attracted $24 billion, but this pales in comparison to redemptions of $139 billion by US-based equity funds. This is a massive red flag, raising questions as to the sustainability of the rally.
There is this, though. Last week, these funds took in $20 billion, which represents the highest weekly inflows since the October bottom in stocks. Bulls obviously hope this is the beginning of a trend. If they are right, then fresh inflows will go a long way at a time when the S&P is sitting right on potentially crucial resistance. Else, a lack of funds – which is buying power – will begin to bite. On the S&P 500, channel top is already a spot where offers can overwhelm bids, as was seen last Friday.
Thanks for reading!
