
Amidst ecstatic bullish sentiment, major US equity indices last week exhibited signs of exhaustion. Confirmation is needed, but equity bears may have an opening here – duration and magnitude notwithstanding.
Equity bulls are too bulled up.
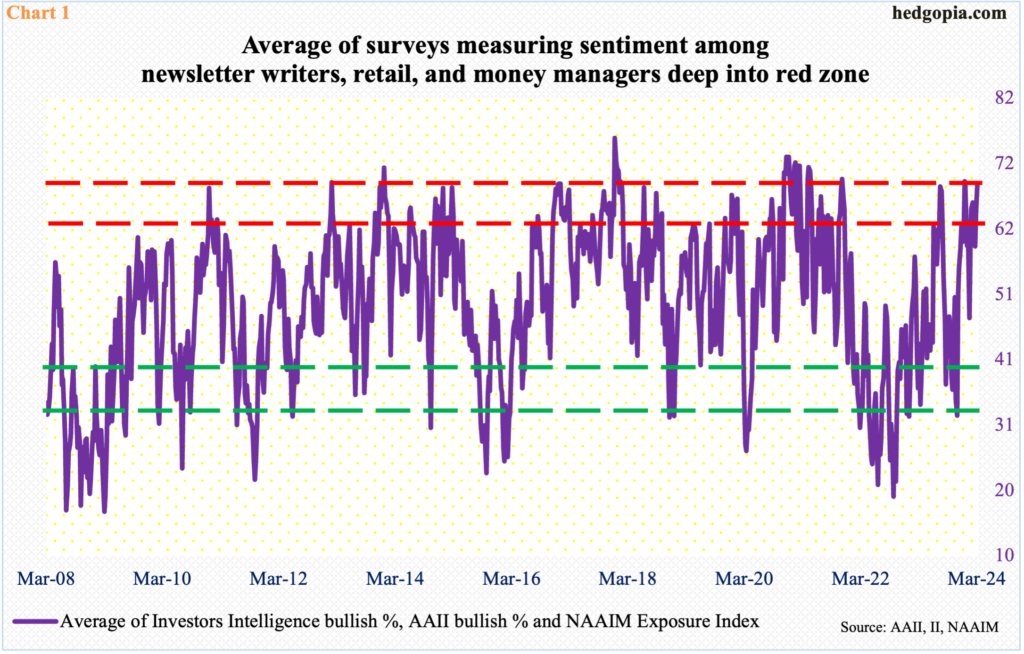
Chart 1 combines three different investor surveys to take out an average measuring the three diverse groups. Investors Intelligence is a survey of newsletter writers, who cater to paying subscribers. The American Association of Individual Investors surveys its members, so it represents a good reflection on individual mood. And the NAAIM Exposure Index surveys how money managers are positioned, with the index measuring National Association of Active Investment Managers members’ average exposure to US stock markets.
In the week to last Tuesday, Investors Intelligence bulls hit 59.4 percent, which is the highest print since July 2021; bears at 16 percent were the lowest since August that year. In the week to Thursday, AAII bulls reached 51.7 percent, a tad lower than last December’s 52.9 percent, which was the highest reading since April 2021. And in the week to Wednesday, the NAAIM index stood at 94 percent; since the week to December 27th when the index hit 102.7 – the highest since November 2021 – there have been three readings in the ’90s.
The average of the three last week was 68.4, within earshot of last December’s 69, which was a 25-month high. The bottom line: the bullish sentiment is pervasive.
Sentiment has remained ebullient for a while now. The Investors Intelligence ratio of bulls to bears, for instance, has been north of three in all but one of the last 12 weeks (not shown here).
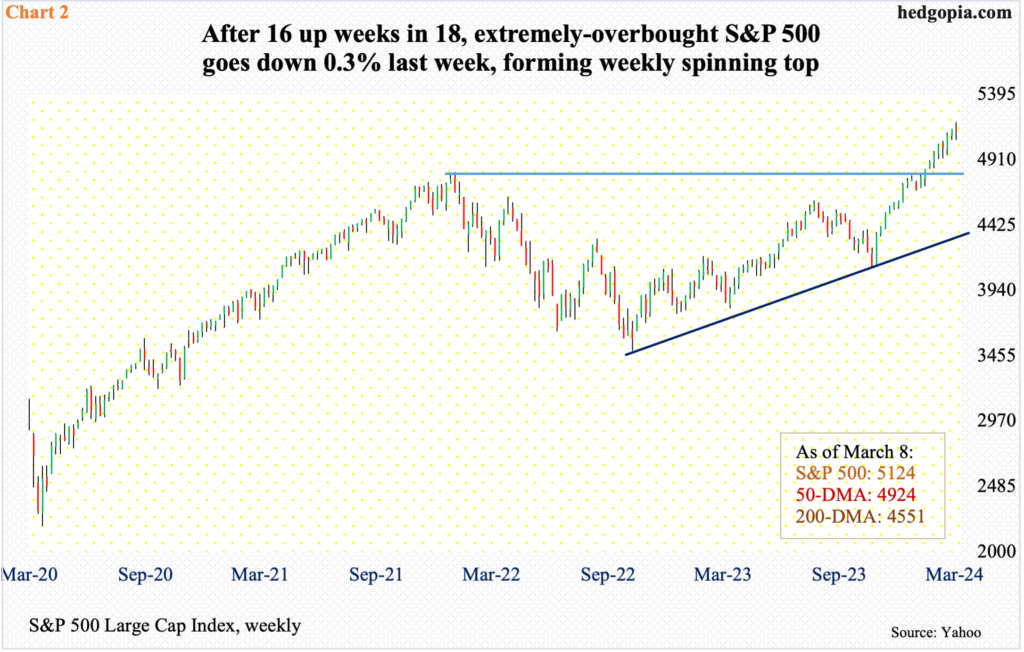
Not surprisingly, major US equity indices have rallied relentlessly since the lows of last October. Going into last week, the S&P 500 was up in 16 of 18 weeks. Through intraday Friday, it was on course for making it a 17 out of 19, but then things began to reverse in the first hour itself. The large cap index ticked 5189 and retreated. By close, it was down 0.3 percent for the week, as opposed to being up one percent at the session high. The weekly formed a spinning top, with a high-low range of 5189 and 5057 and a close of 5124 (Chart 2).
This has the potential to become an important reversal. From last October’s low through Friday’s high, the large cap index rallied 26 percent. That is in a little over four months! This has pushed the index into gross overbought territory, unwinding of which looks imminent in the weeks ahead. Nearest support lies at 5050s.
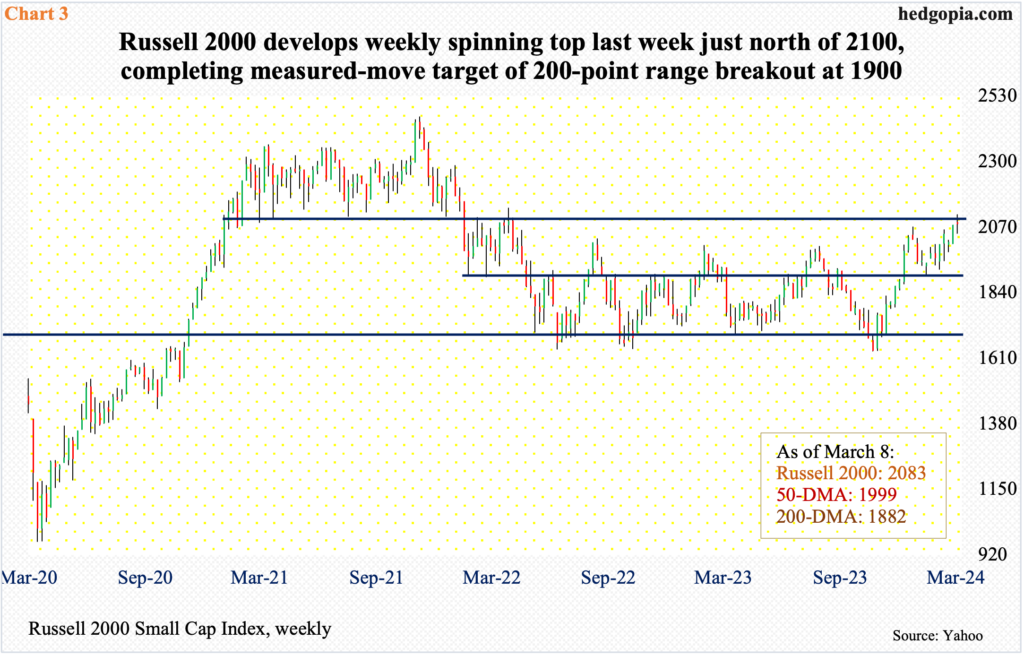
The small-cap arena was not spared either on Friday. The Russell 2000 reached a session high of 2116 and turned lower. This was the highest price point since March 2022. When it was all said and done, the small cap index closed up 0.3 percent for the week to 2079, forming a weekly spinning top. The candle showed up at an interesting spot (Chart 3).
Last October, the Russell 2000 bottomed at 1634, successfully testing the lows of 2022 – 1641 in June and 1642 in October. As it rallied from that low through last Friday’s high, it broke out of 1900 last December. Before that, the index had gone sideways between 1700 and 1900 since January 2022. A measured-move target of this breakout would complete at 2100, and that has now happened. As a matter of fact, 2100 has proven to be important going all the way back to January 2021.
Nearest support lies at 2070s.
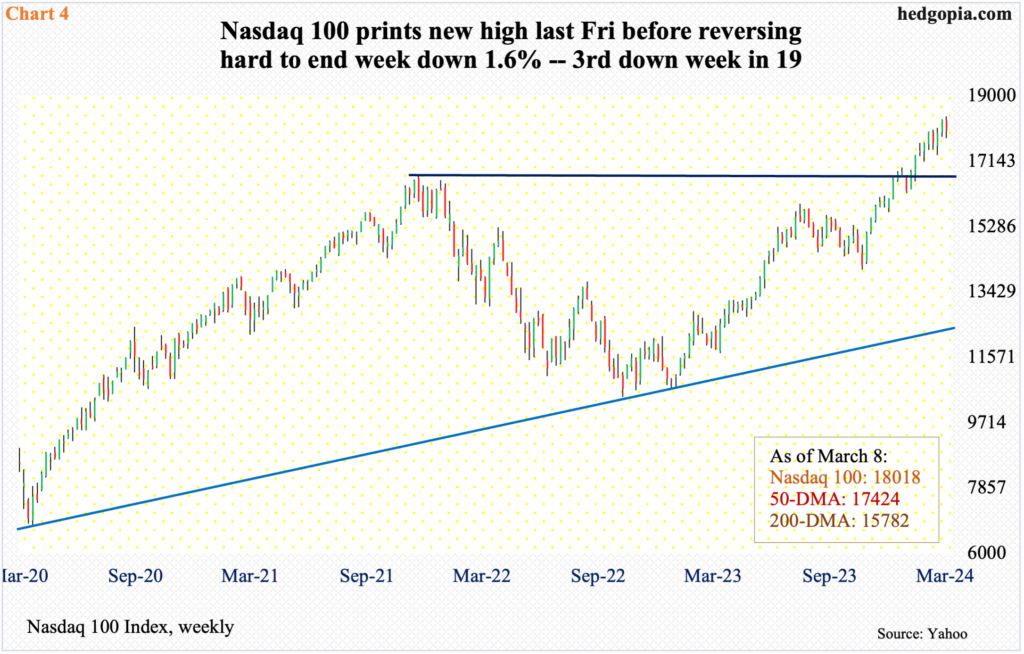
Last Friday’s intraday reversal was particularly apparent in tech. An hour into the session, the Nasdaq 100 was on its way to rally 0.6 percent for the week, which would have been its 17th up week in 19. But that was not to be. After tagging 18415, the tech-heavy index reversed hard to end the week down 1.6 percent to 18018 (Chart 4).
The index evidently finished a tad above 18000, which until a breakout in the week before stopped rally attempts for three weeks. Given how overbought the overall conditions are, odds favor the level gets breached in the sessions ahead.
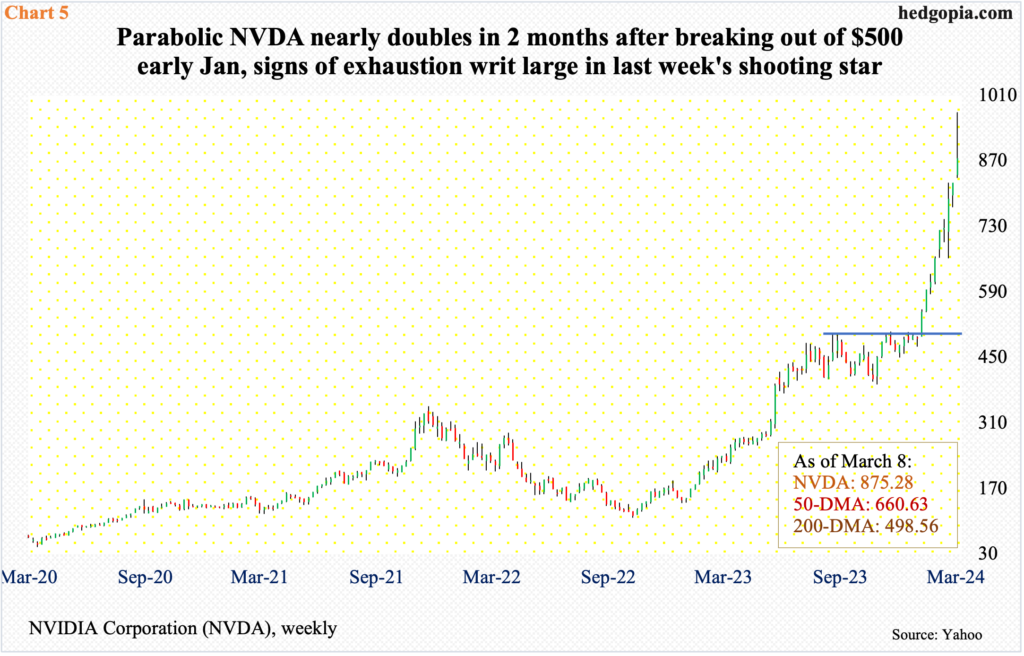
It is possible NVIDIA (NVDA) – the current poster child of ‘overbought’ – suffered a crucial reversal last Friday. The stock closed 2023 at $495, having earlier bottomed at $108 in October 2022, and began to go parabolic in the early sessions of this year, breaking out of $500 (Chart 5). It then rallied for nine straight weeks, including last week, when it added 6.4 percent to $875.
But the real story lies elsewhere. Last Friday, within the first hour, NVDA touched $974 and then ran out of steam. On the daily, a massive, high-volume bearish engulfing candle developed. On the weekly, all this action helped form a shooting star.
These are signs of exhaustion. The stock has come too far, too fast. Unwinding of the extended conditions it is in looks probable. NVDA has quickly transformed itself into a $2.2-trillion market-cap stock and will heavily influence the market-cap-weighted indices.
There is minor support at $820s.
Thanks for reading!
