
Small-caps get no love, even as large-caps rally to new highs. Non-commercials’ bearish position in Russell 2000 mini-index futures is near an 11-year high. At some point in the future, these holdings can provide a tailwind to the cash, as these short positions get covered. Monitoring of key support levels on the Russell 2000, therefore, is important.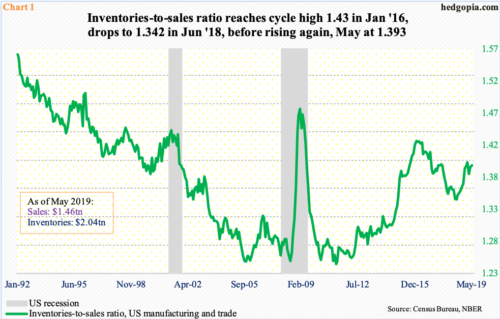
At least going by what is taking place in US manufacturing and trade, inventories are building. The inventories-to-sales ratio in May inched up month-over-month to 1.393. The ratio has been rising since bottoming in June last year at 1.342. Before that, it reached a cycle high 1.430 in January 2016 (Chart 1). May’s reading obviously is nowhere near as high, but the trend has been up over the past year.
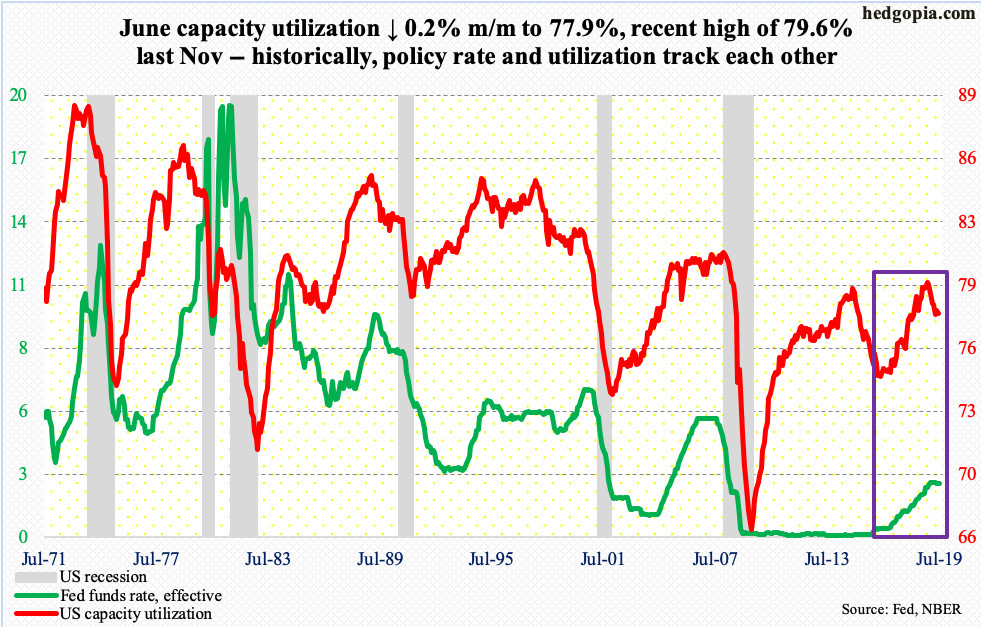
This is one of the macro data points the Fed likely would like to highlight in order to justify an impending rate cut next week. Others include yield-curve inversion and sub-par capacity utilization. Yield spread between 10-year Treasury notes and three-month bills has remained inverted for two months now. Inversion often precedes economic contraction/weakness. US capacity utilization, having never crossed 80 percent in the current cycle, peaked at 79.6 percent last November, with June down 0.2 percent m/m to 77.9 percent (chart).
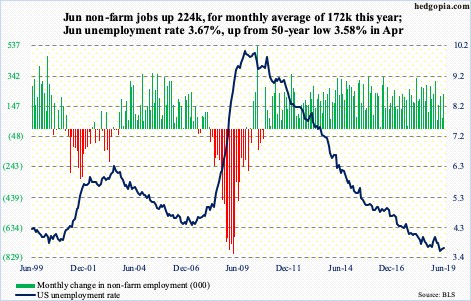
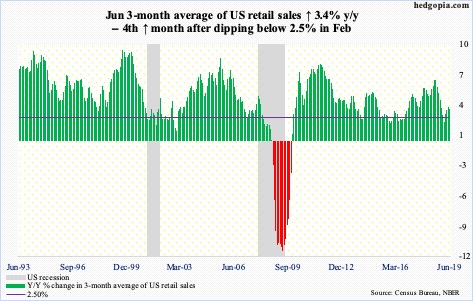
In June, several other data points including retail sales and non-farm payroll hung in there, a fact the Fed is choosing to ignore. Non-farm jobs increased 224,000 (chart), while retail sales were up 3.4 percent year-over-year (chart). Nonetheless, a 25-basis-point cut next week is priced in.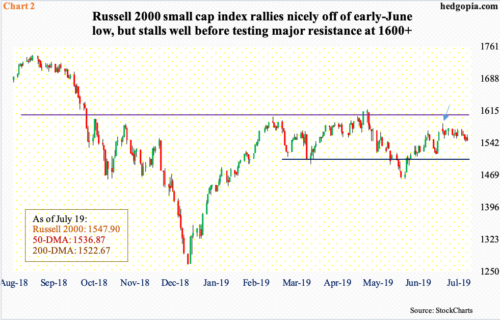
Stocks have rallied into this. Large-caps have done very well. The S&P 500 large cap index, the Nasdaq 100 and the Dow industrials all rallied to new highs last week. Both mid- and small-caps, however, are lagging.
As did other major equity indices, the Russell 2000 small cap index bottomed early June, and on the first this month, rallied to 1586.77, before bears showed up (arrow in Chart 2). That was the closest it came since early May to testing crucial resistance just north of 1600. Record high was reached way back – last August at 1742.09.
Now, shorter-term moving averages are rolling over. The index is still above both 50- and 200-day, but momentum lacks. Both averages are pointing down. Last week’s 1.4-percent decline preceded a potentially bearish hanging man the week before and a long-legged doji before that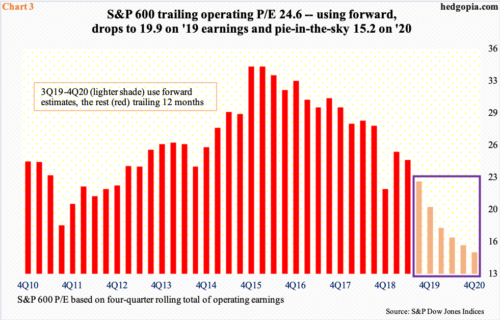
We are in the midst of earnings season, with a lower hurdle, but this has not altered the current apathy toward small-caps. Estimates going into the season in fact have been lowered across the board. For 2Q, operating earnings estimates for S&P 500 companies went from $40.88 when the quarter began to $39.59 last Thursday, for S&P 400 from $27.92 to $26.19, and for S&P 600 from $12.87 to $11.90. But it is only the large-caps that have responded well, not mid- and small-caps.
For small-caps in particular, a combination of downward pressure on both earnings estimates and stocks has resulted in persistent downward pressure on forward multiples. The second quarter ended with a trailing P/E multiple for S&P 600 companies of 24.6x (Chart 3). Use forward estimates, and the multiple drops to 15.2x on next year’s estimates. But increasingly it looks like it is a matter of if these estimates can be trusted. Estimates for this year have gone from $61.63 in June last year to $47.37. In 2018, the sell-side expected as much as $50.66 in March last year; when it was all said and done, $39.05 was earned. For next year, these analysts have penciled in $61.94, which was revised lower from $67.63 in February this year but, given the revision trend, may have a long way to go on the downside.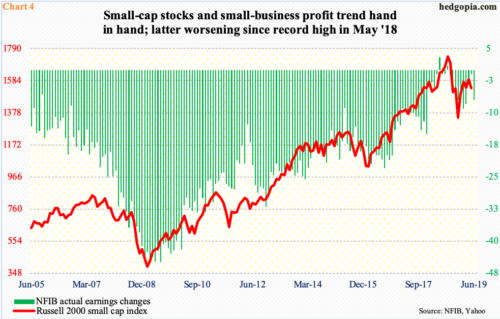
Using the National Federation of Independent Business (NFIB) survey, right at this minute it is not entirely wrong to have these concerns. The NFIB ‘actual earnings changes’ metric peaked in May last year at a positive three. Once again, the Russell 2000 peaked in August. In June (this year), the reading was minus seven, up from minus one in May. Since last year’s peak, the trend has deteriorated (Chart 4). Historically, the two track each other fairly well.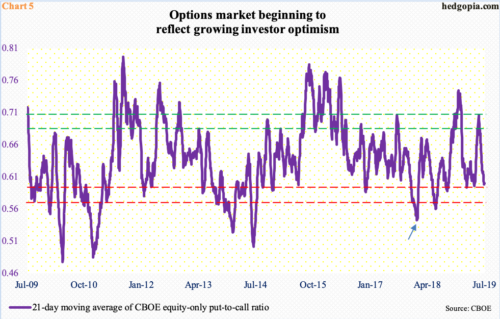
The inability of small-caps, which are considered a risk-on barometer, to draw bids comes at a time when several sentiment indicators are getting extended.
In the options market, the CBOE equity-only put-to-call ratio takes a pulse of investor sentiment based on real money. Chart 5 uses a 21-day moving average, with green and red zones. Currently, it is at, or very close to, the red zone, meaning investor optimism remains elevated.
Last Wednesday, the ratio dropped to 0.598, with Friday at 0.600. Historically, sentiment tends to reverse from high-0.50s to low-0.60s. Worse, it can drop to mid-0.50s, which is what happened in January last year (arrow). But, in either case, reversal risks are rising.
In this scenario, it is probable large-, mid- and small-caps all take it on the chin, and it is possible small-caps continue to bear a bigger brunt as investors continue to seek a perceived safety of large-caps.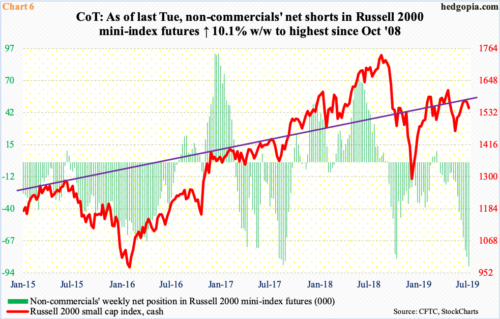
In futures, this is what non-commercials are betting on.
Last week, as of Tuesday, these traders’ net shorts in Russell 2000 mini-index futures rose 10.1 percent week-over-week to 88,737 contracts. This was the highest since October 2008 (Chart 6). As stated previously, the cash peaked last August. Back then, non-commercials were net long. Then, beginning mid-September, they switched to net short, a bias – barring four weeks in March this year – they have maintained since.
At some point, non-commercials’ bearish bias will turn into a tailwind for the Russell 2000 (1547.90) as these traders cover their shorts. Monitoring of support levels, therefore, is key. On the upside, bulls need to recapture 1660+ to regain momentum. Until then, the bias remains down. Besides the 50- and 200-day (1537 and 1523, respectively), there is four-month horizontal support at 1510 (Chart 2). Right around there lies trend-line support from last December’s lows. It is a must-hold.
Thanks for reading!
