
Since last Wednesday, there has been a sudden pickup in QE talk. That was when Bill Dudley, president of the New York Fed, said that “the decision to begin the normalization process at the September FOMC meeting seems less compelling to me than it was a few weeks ago.”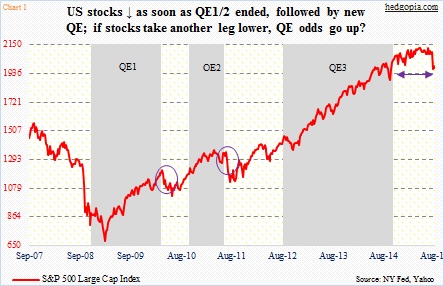
Markets were in turmoil then. By last Tuesday, the S&P 500 Index was down 12.5 percent from the May high. Given how QE evolved during and after Great Recession, markets were not totally out of sync to be weighing QE odds. Particularly so because Mr. Dudley also said that the stock market needed to move a lot and stay there for it to actually have implications for the U.S. economy.
Chart 1 helps us get a good sense of how markets in the past reacted to QE, and vice versa.
U.S. stocks, in free fall before QE1 got going in November 2008, rose during QE but had nervous breakdown as soon as it ended. The pattern repeats itself ahead of, during and after QE2. QE ends, stocks come under pressure and get a new lease of life as soon as new QE gets underway. QE3 was an exception, in that stocks did not immediately drop as it came to an end. Now they are under pressure. Hence the question, are stocks belatedly catching up to QE3-end?
Using this logic, between now and September 16-17, when the FOMC meets, how stocks behave probably matters more than macro data points.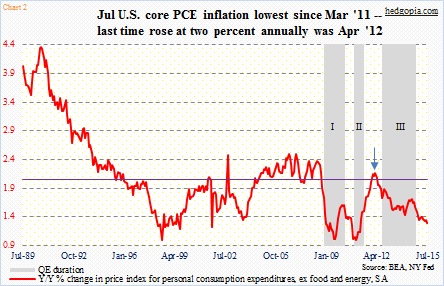
Employment and price stability, which make up the Fed’s dual mandate, have not been in sync. This is no news.
Core PCE inflation rose at an annual rate of 1.7 percent in November 2008. After three iterations of QE, and expansion of the Fed’s balance sheet by $3.7 trillion, this measure of inflation is still a no-show. July only produced a 1.2 percent reading. Throughout the recovery, the only time it rose north of two percent was in January-April 2012 (arrow).
The Fed targets two percent inflation – but not getting it. This is fodder for doves like Narayan Kocherlakota, president of the Minneapolis Fed, who argues that Fed officials should be thinking about easing monetary policy.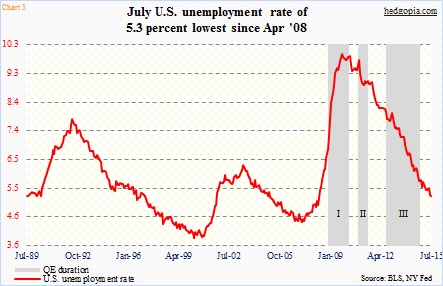
Then we have Chart 3, which leads hawks like Dennis Lockhart, president of the Atlanta Fed, to argue that the U.S. economy is “just a shade” from full employment. In November 2008, the U.S. unemployment rate was 6.8 percent, before rising to 10 percent in October 2009. This July, it dipped to 5.3 percent – the lowest since April 2008. A total of 9.8 million non-farm jobs have been created post-Great Recession. The population grew by 14.5 million, to 321.6 million, during the period.
Though the fact remains that the drop in unemployment has not been due to all the good reasons.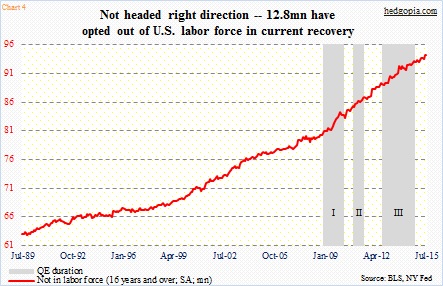
Even as the unemployment rate has nose-dived, nearly 13 million Americans have opted out of the labor force. When Great Recession was ending in June 2009, the ‘not in labor force’ category stood at 80.9 million (Chart 4). The civilian labor force participation rate was 65.7 percent back then. Fast forward to July this year, these two were respectively 93.8 million and 62.6 percent. The latter was the lowest since October 1977.
Also not moving in tandem with the unemployment rate is how wages are behaving. In July, average hourly earnings of U.S. private-sector employees rose five cents, to $24.99; year-over-year, they were up 2.1 percent. As seen in Chart 5, annual growth has been stuck in the two-percent range post-Great Recession. The last time it grew with a three handle was in April 2009.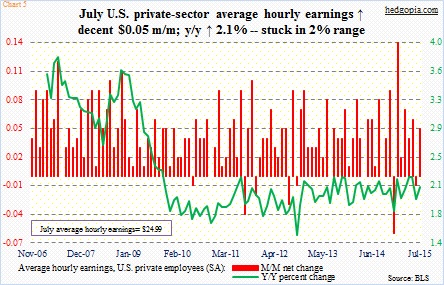
What it tells us is this. For months now, there has been a constant drumbeat of policymakers wanting to get off the zero bound. However, using Charts 2 and 3, both sides – doves and hawks – can make cogent arguments. In the end, it may just end up being a wash. The Fed is in a box. A decision not to hike in September will be a lot easier should the stock market take another leg lower. Then markets can obsess over QE odds – not rate-hike odds.
Thanks for reading!
