
Both large- and small-caps rallied strong last week but retreated on Friday after filling the June 10th gap. The Nasdaq 100, too, filled the gap but kept rallying, only to see some selling on Friday. Tech’s relatively better performance – slightly – comes ahead of June-quarter results this week from the leading tech outfits.
The S&P 500 rallied 2.5 percent last week, building on the momentum from the prior week when Wednesday and Thursday in particular saw heavy dip-buying. Last week, bulls reclaimed the 50-day on Tuesday, with the average attracting bids in the next two sessions. The large cap index rallied further intraday Friday but only to entice selling near dual resistance as the session wore on.
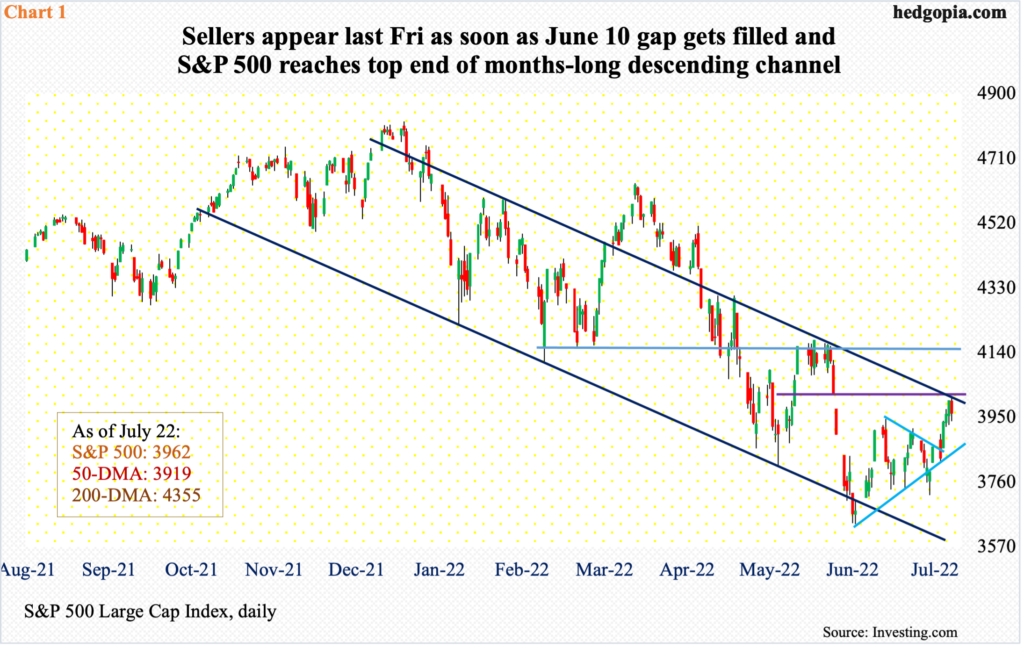
On June 10, the S&P 500 gapped down. At Friday’s high of 4012, that gap was just about filled. This is also where the upper bound of a months-long descending channel lied (Chart 1). The daily was getting extended, and sellers used this dual resistance as an opportunity to reduce exposure.
In the event further weakness develops this week, there is trend-line support at 3900. The 50-day (3919) lies just above that. If, however, the weekly prevails, the next decent resistance is not until 4160s. The index closed out the week at 3962.
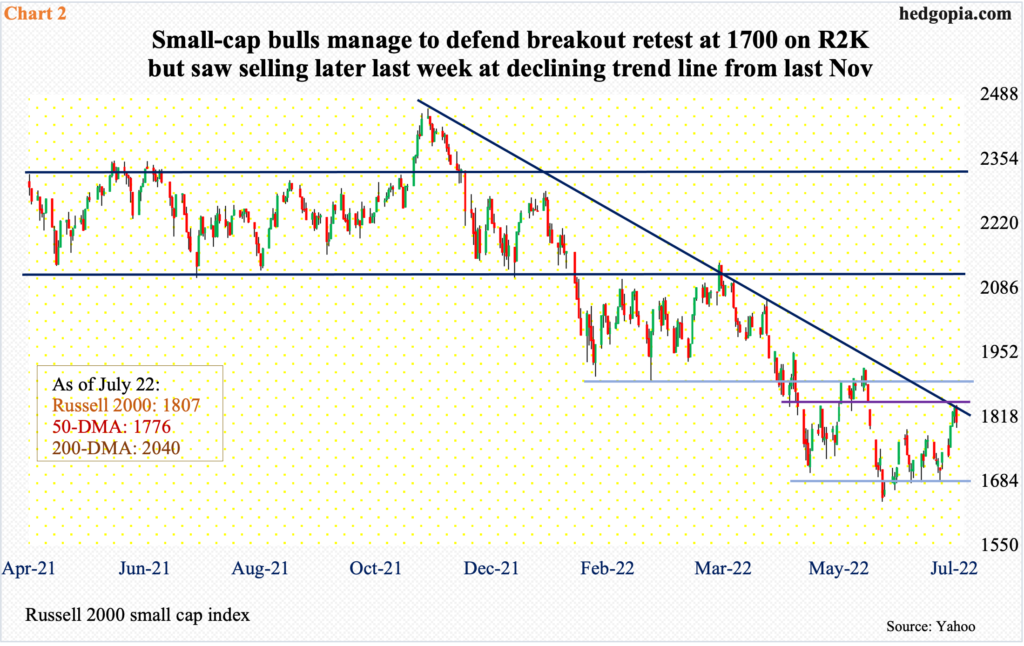
Similar dynamics played out on the Russell 2000 last week. It rallied 3.6 percent for the week, ticking 1842 intraday Friday but only to end the week at 1807. Offers appeared as soon as the gap from June 10 was filled. This level also coincided with a falling trend line from last November when the small cap index peaked at 2459. From that high through last month’s trough at 1641, it tumbled 33.2 percent.
Through all this, small-cap bulls were able to defend 1700, which is where the Russell 2000 broke out of in November 2020. Bears tried to sustainably penetrate that for a whole month, but to no avail (Chart 2).
Earlier, they forced a major breakdown mid-January, when 2080s was lost; for 10 months, the index went back and forth between 2080s and 2350s. It then seesawed between 2080s and 1900, followed by a ping pong match between 1900 and 1700.
A rally past the dual resistance mentioned above would have opened the door toward testing 1900.
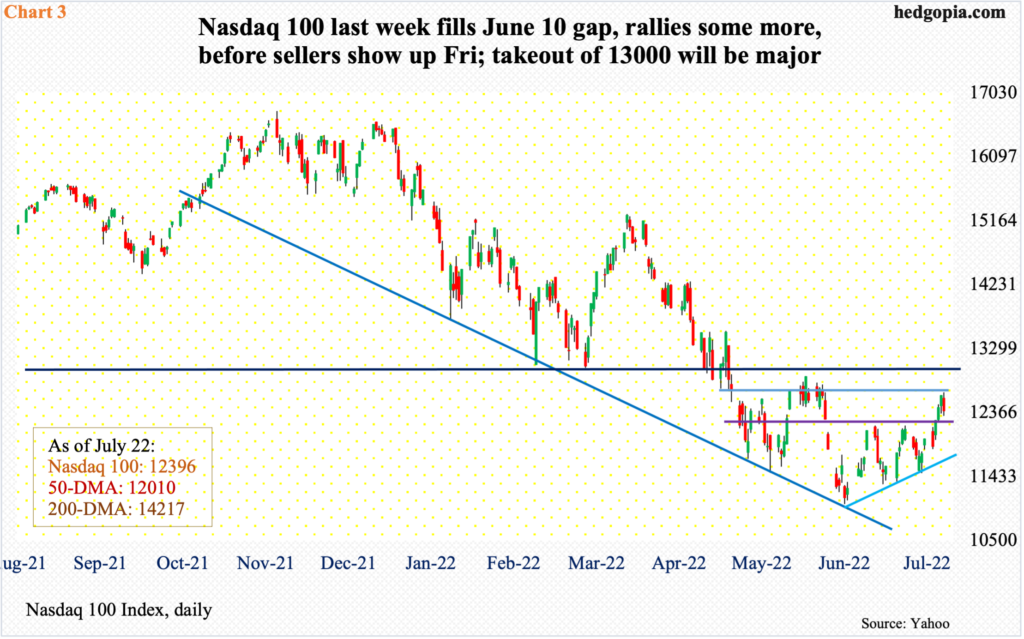
The Nasdaq 100, unlike the two indices above, filled the gap from June 10 last Tuesday and continued to rally on Wednesday and Thursday, before selling off 1.8 percent on Friday to end just above where the gap was filled (Chart 3).
Leading up to this, the tech-heavy index (12396) plunged 34.2 percent between last November’s high of 16765 and the low on the 16th last month of 11037 to find support at a trend line from last October.
From that low, the index has made higher lows. The rally thereof went on past the gap-down resistance. Last Friday’s high came at lateral resistance at 12600s. Bulls will have scored a major victory once they recapture 13000.
This week is key.
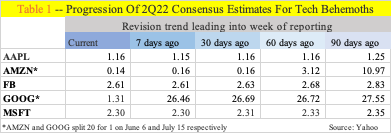
US tech behemoths will report their June quarter this week. Microsoft (MSFT) and Google owner Alphabet (GOOG) will report on Tuesday, Facebook owner META on Wednesday, and Apple (AAPL) and Amazon (AMZN) on Thursday.
Estimates for all these five have gradually trickled lower over at least the past 90 days. (Both AMZN and GOOG split 20 for one recently.) The lower consensus gives them a lower hurdle to jump over. At the same time, this could also be a sign that fundamentals are deteriorating, as higher interest rates pass through the system.
Their results, and how markets react to them, will matter. The Nasdaq 100 is a market cap-based index, as is the S&P 500. The higher the market cap of a constituent stock, the more its influence on the index.
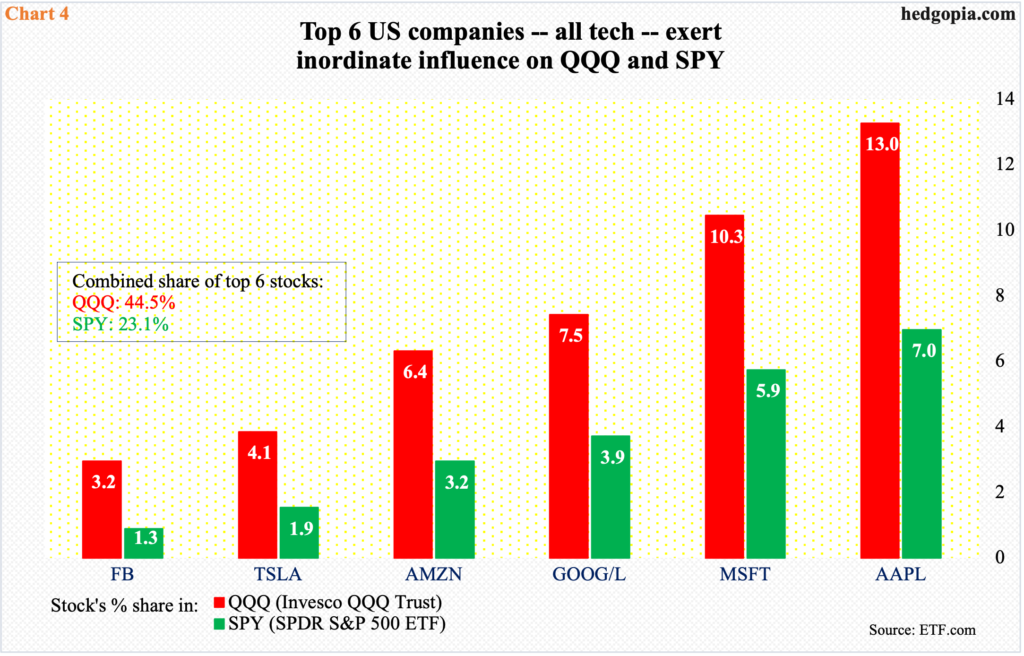
AAPL, for instance, wields a 13-percent weighting in QQQ (Invesco QQQ Trust) but only 1.04 percent in QQEW (First Trust Nasdaq-100 Equal Weighted Index Fund). It understandably will have a lopsided impact on QQQ, regardless which way the stock goes.
In essence, as go the stocks of five companies, so goes the Nasdaq 100 post-earnings. They are the big wigs in tech. AAPL is the largest at $2.5 trillion in market cap, with MSFT trailing with just under $2 trillion, GOOG at $1.4 trillion and AMZN at $1.2 trillion. The least expensive of the five is META and it is worth $458 billion, below Tesla (TSLA) at $846 billion, which already reported.
Combined, as seen in Chart 4, the top five reporting this week has a 44.5-percent share in QQQ and 23.1 percent in SPY (SPDR S&P 500 ETF). They can easily move these ETFs/indexes, hence the significance of how their results are viewed.
Trading action leading up to this has been encouraging. But nothing is certain, with the daily entering overbought territory and sellers showing up at resistance in both large- and small-caps. What the bulls would want to see is post-earnings weakness generating buying interest.
Thanks for reading!
