Arguably, both bulls and bears won last week. Bears began the week with a big growl. Monday, the S&P 500 large cap index dropped three percent and the Nasdaq 100 3.6 percent. Intraday, in fact, there were respectively down 3.7 percent and 4.4 percent. Amidst this carnage, bulls stepped up in defense of important support.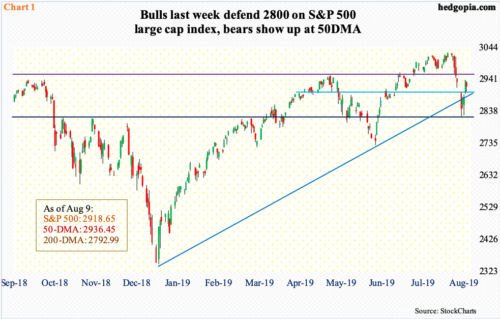
On the S&P 500, 2800-plus has been an important price point for bulls and bears alike going back to March last year. Monday’s low was 2822.12 (Chart 1). Bulls again defended that support Wednesday when intraday the S&P 500 was down 1.9 percent but managed to crawl its way back up to end the session up 0.1 percent. From Monday’s low through Thursday’s high, the index rallied 4.1 percent. Then, it was bears’ turn to show up, which they did both Thursday and Friday at the 50-day moving average (2936.45).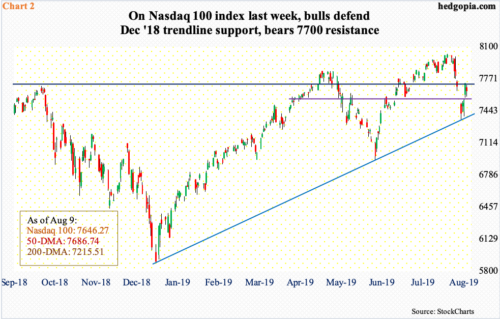
On the Nasdaq 100 index, in the midst of Monday’s selling, bulls showed up to defend a rising trend line from last December, when major equity indices put in important lows (Chart 2). That same trend line on the S&P 500 was breached Monday but recaptured Thursday (Chart 1).
In the end, from down 4.4 percent intraday Monday to down 0.6 percent, the Nasdaq 100 staged quite a reversal last week. The only problem is, sellers showed up where they could potentially have. There was one-year horizontal resistance at 7700, and it held. As did the 50-day (7686.74).
For now, the Nasdaq 100 (7646.27) is stuck between 7700 and short-term horizontal support at 7550s. Similarly, on the S&P 500 (2918.65), there is resistance at 2950s-60s and support at 2900. A loss of this support exposes the S&P 500 to a breach – once again – of the December 2018 trend line, followed by a test of 2800. A loss of 7550s raises the odds the Nasdaq 100 proceeds to test a trend line from that same date.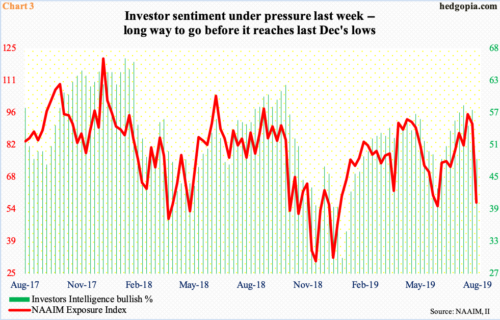
To that end, this week will be crucial. On both indices, the daily RSI has turned back lower from just under 50. If the downward momentum continues, the afore-mentioned support needs to hold. Else, the path of least resistance is 2800 on the S&P 500 and 7400 on the Nasdaq 100. The 200-day lies at 2792.99 and 7215.51, in that order.
In this scenario, investor sentiment continues lower. Last week, Investors Intelligence bulls fell 9.1 percentage points week-over-week to 48.1 percent – first sub-50 reading in eight weeks – while the NAAIM Exposure Index dropped 34.8 points w/w to 56.59, a nine-week low (Chart 3). For reference, early June, when stocks began to rise after May’s decline, they respectively read 42.7 percent and 54.99. In December last year and January this year, when stocks were bottoming after a three-month decline, sentiment was much lower – Investors Intelligence bulls at 29.9 percent early January and NAAIM at 31.96 mid-December. Should bears take control, sentiment has a lot to go on the downside.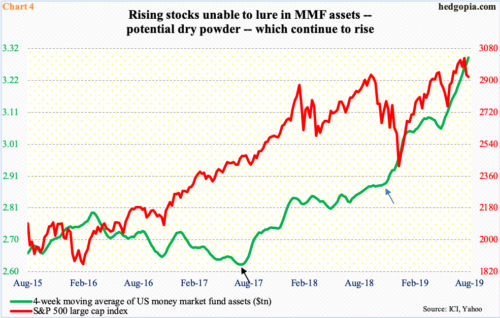
In this scenario, bulls’ hope that money-market funds, which have been persistently rising for a while now, begin to move into equities remains just that – hope. These assets are at an elevated level. Last week, as of Wednesday, they jumped $57.7 billion w/w to $3.34 trillion. This was the highest since November 2009.
Chart 4 pits a four-week moving average of these funds against the S&P 500. Interestingly, it has been two years since the green line began trending higher (black arrow), and particularly so since last November (blue arrow). This is a potential dry powder, and for that, it has to begin to contract. From the lows of December through July’s high, the S&P 500 rallied 29 percent. Yet, money-market assets continue higher.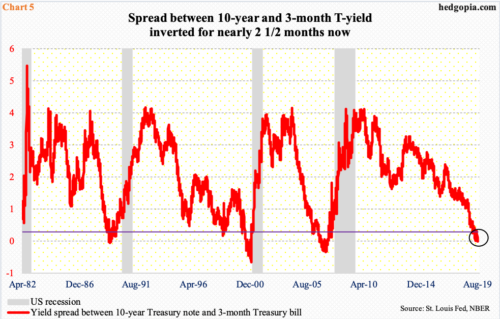
It is clear that, despite the new highs in the S&P 500, and other indices, there is a lot of money that continues to believe the equity rally is not for real. One reason for this is the fact that the business cycle is already a decade old and macro data are coming in mixed. Bulls can focus on the positive aspect of the macro picture and bears on the negative.
Chart 5 serves as an example, which equity bears can point toward.
The yield spread between 10-year Treasury notes and three-month bills has remained inverted for two and a half months now. Historically, this has been a recession signal. At some point, the economy will contract. The cycle is long in the tooth, and there are signs of wear and tear. Recession is just a matter of time. The only question is if it begins next year, the year after or a few years down the road. In this regard, the bond market is worth watching. Currently, it is not sending the right vibes.
The 10-year Treasury yield (1.73 percent) dropped to 1.6 percent intraday last Wednesday – the lowest since September 2016. July that year, rates fell to 1.34 percent, which was essentially a successful retest of 1.39 percent set in July 2012. It is probably just a matter of time before the 10-year heads back down there, and this time around the support may not hold. Most recently, rates peaked at 3.25 percent last October, and it has been all downhill since. This has been a fallback argument for equity bears – reason why money-market assets continue rising. At some point – too soon to say if it is going to be weeks, months or quarters – these assets will act as a tailwind for equities. Until then, bulls will have to find some other ways to hang on to support. This week, their mettle will be tested.
Thanks for reading!

