
Both large- and small-caps failed at crucial resistance last week. Investor focus shifted toward fundamentals that could wobble in the months and quarters ahead. The upward move in equities since last October’s low was a technical move, unwinding the oversold condition the major indices were in. Now, conditions are overbought.
US equities took a hit last week. This is taking place at a time when investor sentiment remains highly elevated.
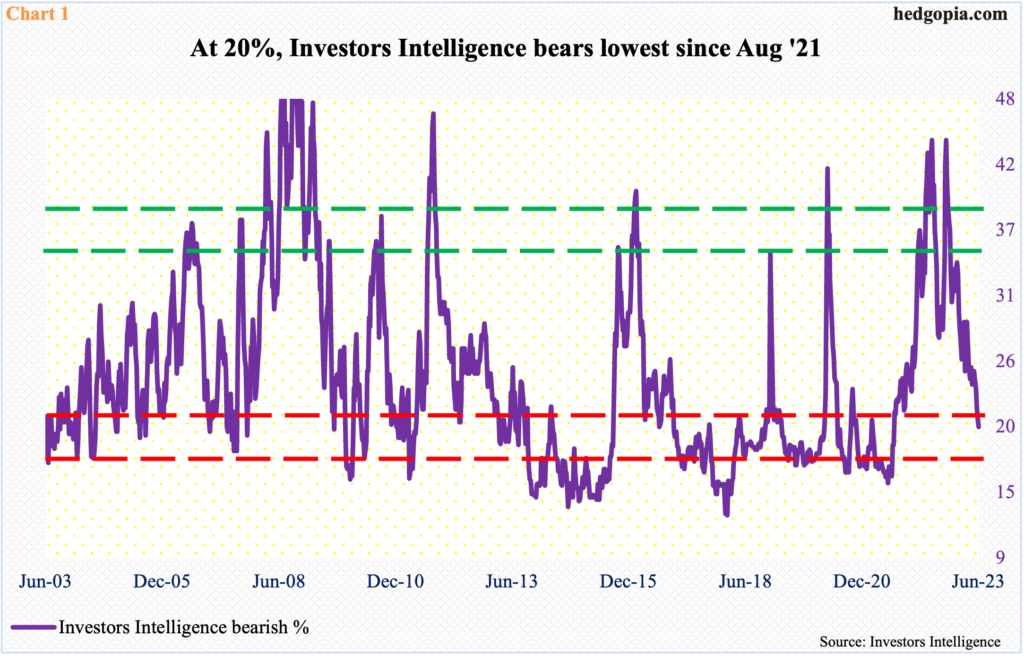
In the week to last Wednesday, Investors Intelligence bulls rose nine-tenths of a percentage point week-over-week to 54.3 percent. This was the third week in a row of 50-plus readings and the highest since November 2021. The bearish percent, in the meantime, dropped six-tenths of a percentage point to 20 percent. Bears have not been this low since August 2021.
In June and October last year, bears shot up to 44.1 percent, which was the highest print since October 2011 (Chart 1). This led the foundation for the rip-roaring rally in the major US equity indices post-October bottom. Sentiment is at the other extreme now.
This is also evident in the options market. Volatility is dangerously suppressed.
Last week, for the first time since January 2020, VIX broke 13, tagging 12.73 on Thursday and 12.88 on Friday. The index also dropped 0.1 point to 13.44, directionally moving in unison with the S&P 500, which fell 1.4 percent for the week. This equity-volatility behavior is rare, as the two tend to move in opposite directions.
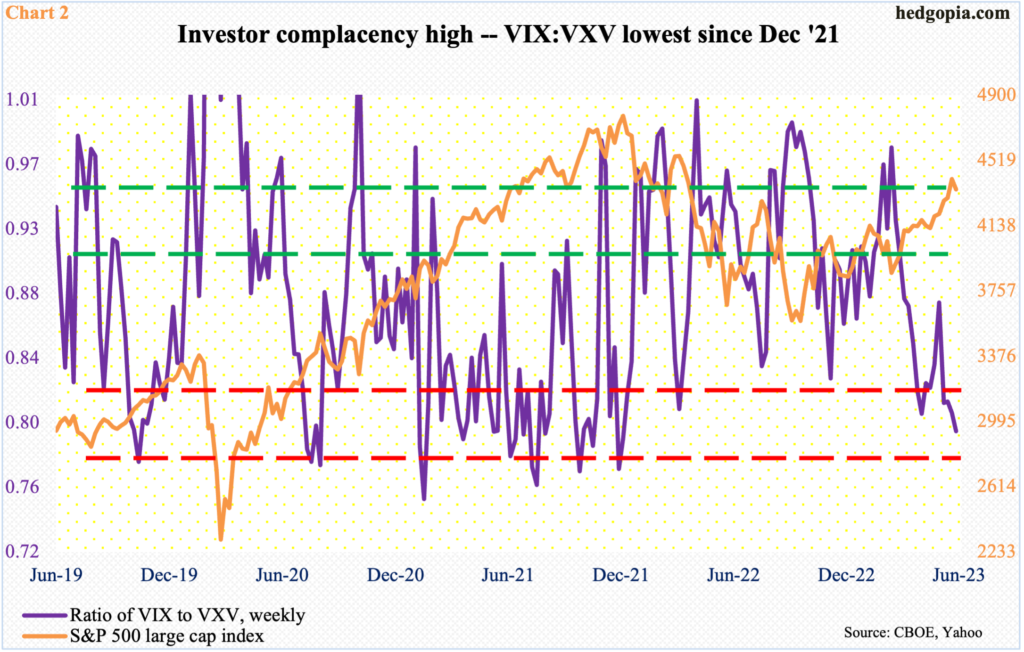
VIX measures market’s expectation of 30-day volatility on the S&P 500. VXV does the same, except it goes out to three months. When the investing climate is risk-on, as has been the case of late, demand for VIX-derived securities is lower than, let us say, VXV. The opposite is true when investor sentiment wanes. Last week, the ratio of VIX to VXV hit 0.797, which was the first sub-0.80 reading since December 2021 (Chart 2).
Odds now strongly favor volatility begins to go the other way – if nothing else just to unwind VIX’s oversold condition. When this happens, demand for nearer-term protection should strengthen, unwinding the currently oversold ratio between VIX and VXV.
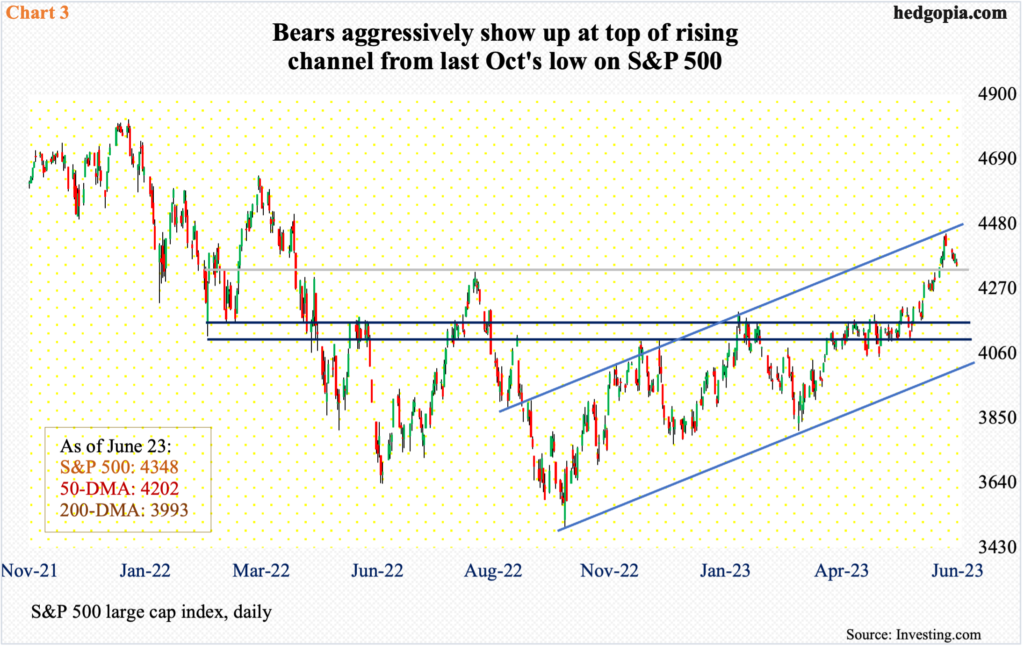
From last October’s low through the 14-month high 4448 on June 16, the S&P 500 jumped 27.4 percent. Along the way, the large cap index took care of several roadblocks, with 4320s falling most recently. Before that fell 4170s and 4100.
The bullish momentum was so strong that the daily RSI crossed 77 on the 15th. Momentum begets momentum – until it does not. On the 16th, the S&P 500 hit 4448 before reversing. The reversal took place at an important juncture.
The index has traded within an ascending channel since last October. The high on the 16th just about kissed the upper bound of the channel (Chart 3). Immediately ahead, 4320s is where a bull-bear duel likely unfolds. Once this gives way, the next level to watch is 4200, which also coincides with the 50-day moving average (4202). The S&P 500 closed last week at 4348.
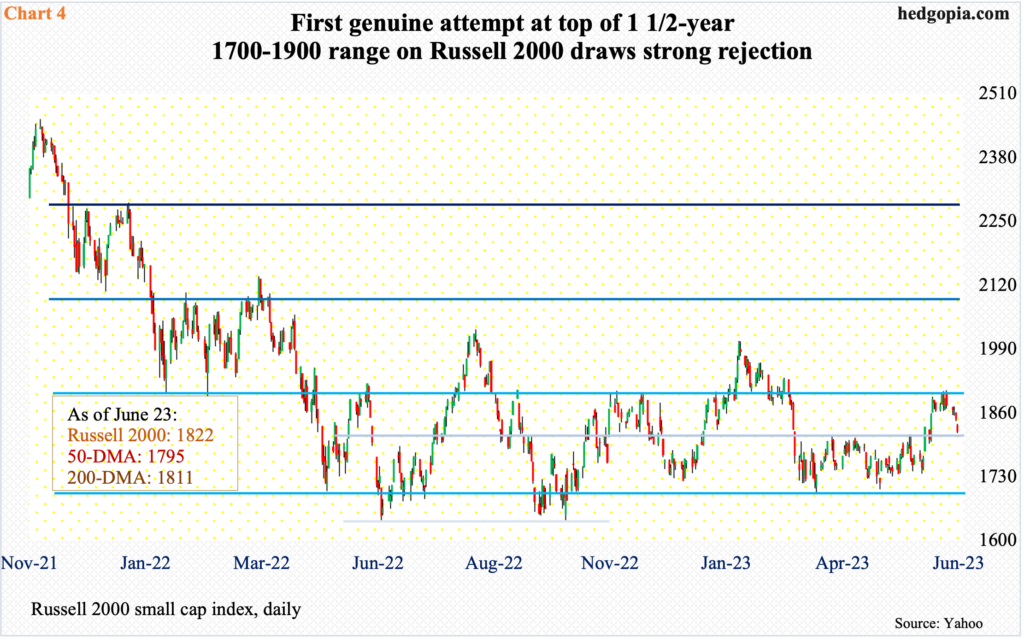
The same way the S&P 500 drew offers at an important resistance, the Russell 2000 failed at a one-and-a-half-year resistance.
The small cap index has been rangebound between 1700 and 1900 since January last year (Chart 4). The top end of the range was lost early March (this year) and had not been tested since – until the week before when the Russell 2000 reclaimed 1900 intraday in three of the five sessions but only to fall back under by close. Last week, it tagged 1874 intraday Wednesday but by then the bears were in control; the index closed the week lower 2.9 percent to 1822.
Support at 1700 goes back to August 2018. Once 1800 gives way, odds heavily favor a test of the bottom of the range sooner than later.
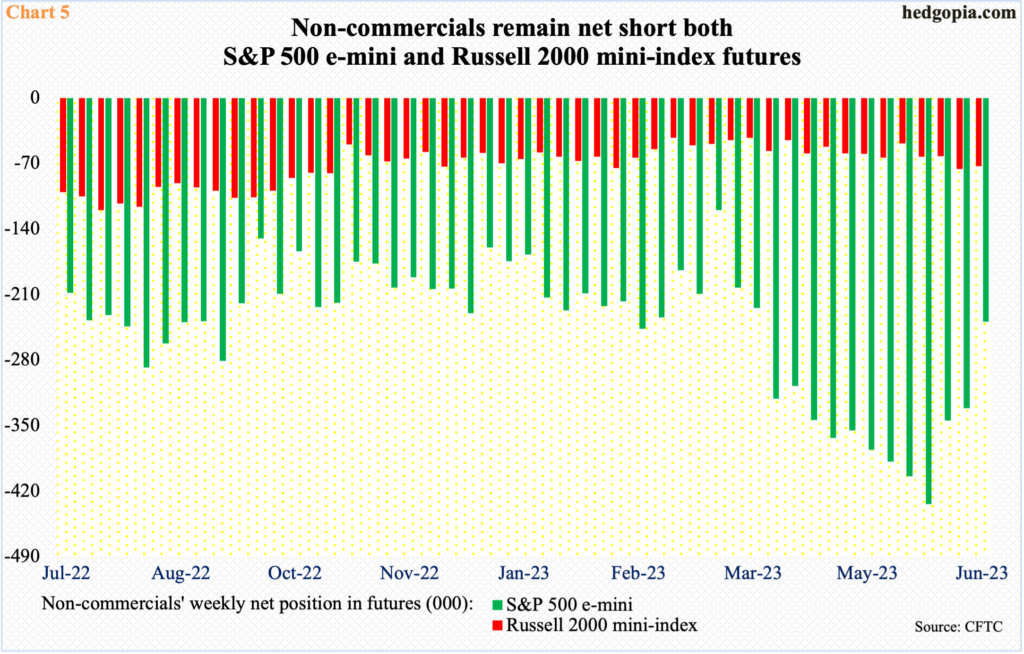
In the futures market, non-commercials are staying put with their holdings of net shorts in Russell 2000 mini-index futures. In the week to last Tuesday, they reduced positions by 3,187 contracts but the prior week’s 75,896 was a 33-week high. These traders have been net short since March 2021.
From this standpoint, non-commercials have been net short e-mini S&P 500 futures for a year now. In the week to May 30, they were net short a record 434,170 contracts. From that high, holdings have been cut back 45 percent but at 239,331 still remain high (Chart 5).
In both these contracts, if the signal coming from the cash is any indication, non-commercials stand to do well in the coming weeks.
Arguably, the massive rally in the major US equity indices since last October’s low was technical in nature. At the trough, metric after metric was in severely oversold condition. Unwinding was natural. Lots of metrics have now gone to the other extreme.
The S&P 500’s rejection at the channel top took place at a time when several metrics are yelling overbought. Overbought can remain overbought, but for that to happen, fundamentals need to cooperate.
Increasingly, it seems the Federal Reserve, facing a sticky inflation, has no option than to drive the economy into a recession – or at least engineer a significant deceleration in which the still-robust jobs market gets hurt, and with that brings sustained downward pressure on inflation, which is now at four- to five-percent range, versus the central bank’s two percent target.
This is probably why both the S&P 500 and the Russell 2000 got denied at their respective resistance. Separately, it is likely fed funds futures traders, too, are anticipating massive deceleration in economic activity next year.
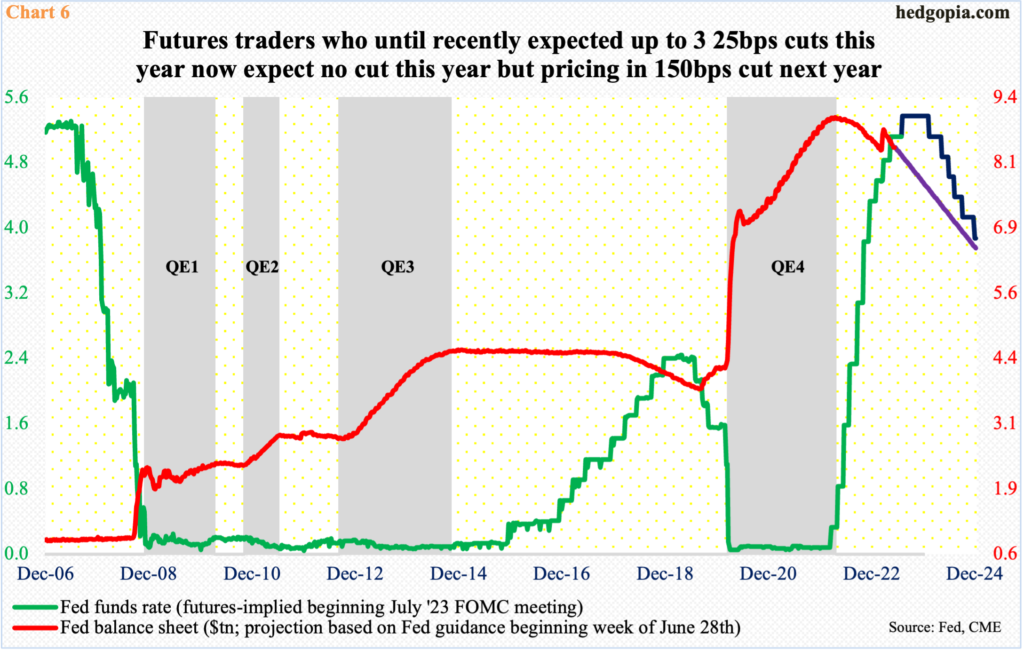
The fed funds rate currently stands at a range of 500 basis points to 525 basis points, up from zero to 25 basis points in March last year. Concurrently, the balance sheet is being reduced.
In this month’s FOMC meeting, the dot plot heavily favored two more 25-basis-point hikes this year before calling it quits. In the futures market, traders are only betting on one hike – in July – before the Fed ends its tightening campaign. For next year, these traders are betting on a massive reduction in the benchmark rates, ending 2024 between 375 basis points and 400 basis points (Chart 6). It is hard to imagine this scenario coming to pass unless both the economy and inflation head south – substantially at that. US equities currently are not priced for this. This creates an opportunity for the overbought condition the indices are in to unwind.
Thanks for reading!
