Until recently, it looked like the Fed finally had the fortitude to take on inflation head on. Now, the message is getting blurred. Within the FOMC, for every Bullard, there is a Kashkari. Amidst this push-and-pull, late-January lows on major US equity indices are worth watching, as they can hold clues.
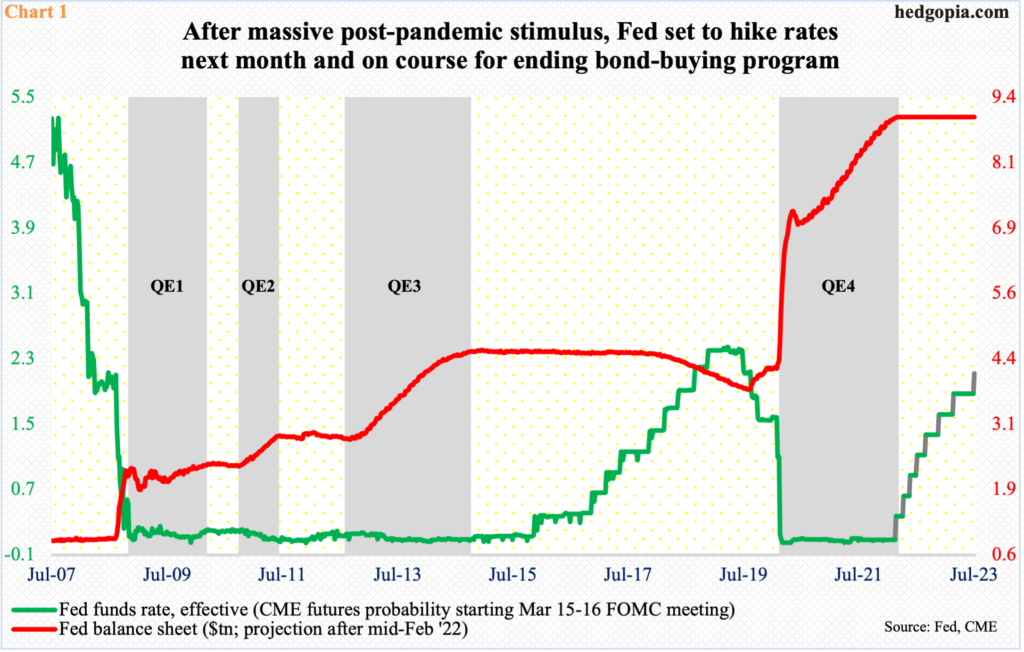
The FOMC meets on March 15-16. This is still three weeks away, so a lot could happen in between. As things stand, futures traders expect a 25-basis-point hike from the current range of zero to 25 basis points. Immediately after January’s consumer price index (CPI) report on the 10th (this month), the probability of a 50-basis-point hike in next month’s meeting shot up to 94 percent but are only 13 percent currently.
It is possible these traders readjusted their expectations as several FOMC members came out in support of a restrained approach to rate hikes. Neel Kashkari, president of the Minneapolis Fed and a voting member next year, advised last week “not to overdo it.”
At the other end of the spectrum are the likes of Jim Bullard, St. Louis Fed president and a voting member, who said last week that he would favor hiking the fed funds rate by a full percentage point over the next three meetings and that rates would need to rise above two percent to tame inflation.
In the futures market, traders expect the fed funds rate to hit that level by July next year. Chart 1 also assumes that the Federal Reserve will stop its bond-buying program next month, and its asset pile goes flat at $9 trillion.
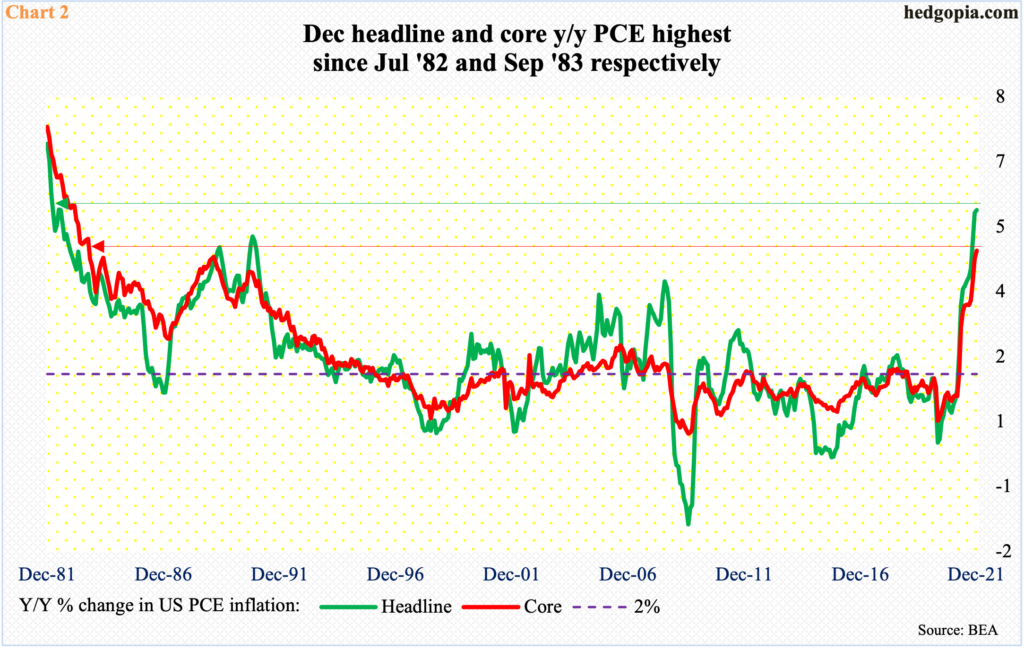
This Friday, traders will get another opportunity to recalibrate their expectations. The personal consumptions expenditures (PCE) index is due out for January. Inflation has simply gone through the roof.
In April 2020, amid Covid-19 disruptions, headline and core PCE respectively rose a subdued 0.4 percent and 0.9 percent year-over-year. In December (last year), they shot up 5.8 percent and 4.9 percent, in that order; prices had not risen that fast since July 1982 and September 1983 respectively (Chart 2).
Core PCE is the Fed’s favorite. If these measures show signs of softening on Friday – or even rise less than the consensus – this will provide more ammo to the likes of Kashkari. The projected path of tightening could look a whole lot different in the futures market.
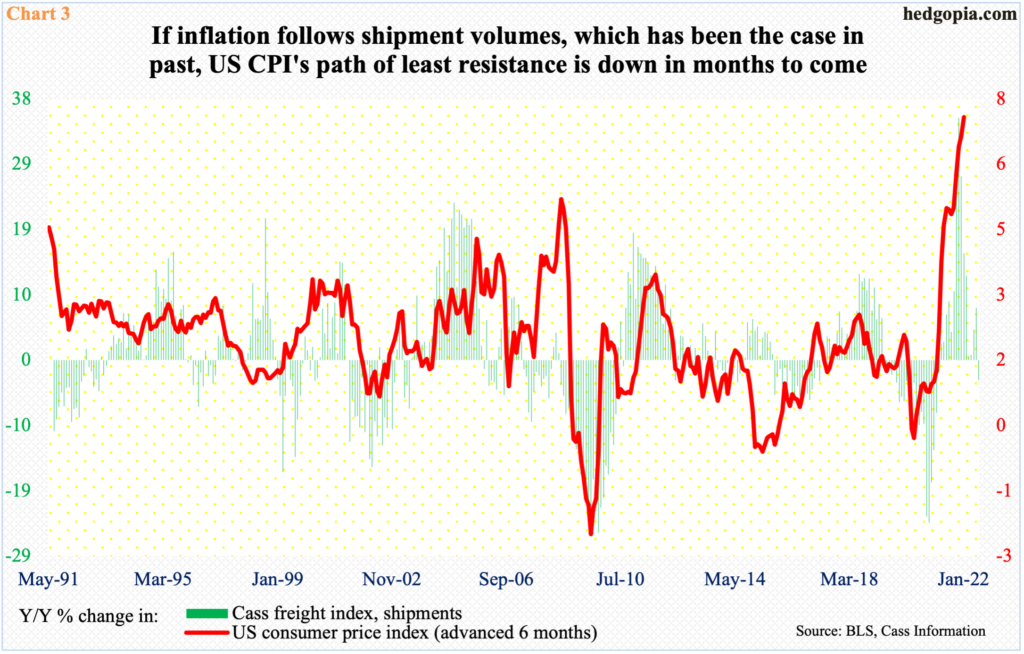
Already, indicators such as the Cass Freight Index are pointing to softer inflation in the months to come.
In January, its shipments index declined 2.9 percent y/y. This was the first y/y decrease in 16 months. Last May, it surged at a record 35.3 percent.
If past is prologue, this tends to precede behavior in consumer inflation. In Chart 3, headline CPI is advanced by six months. If – a big if – the red line follows the green histograms lower, inflation has lots of catching up to do on the downside.
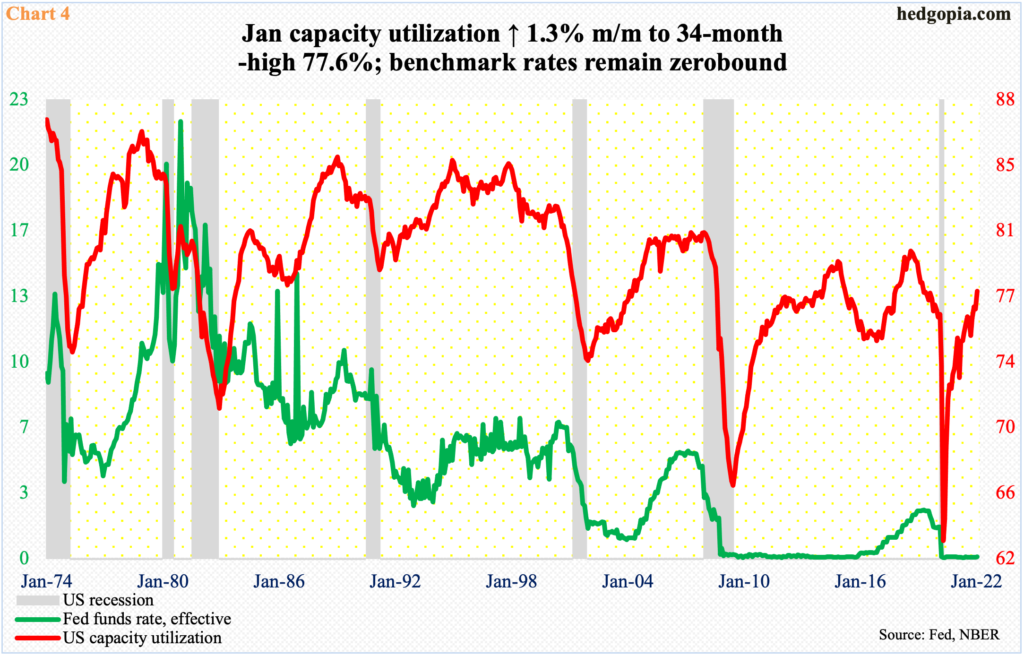
Ironically, because benchmark rates have been left zero-bound since pretty much the 2008/2009 financial crisis, they have got lots of catching up to do themselves.
In June 2009, the month Great Recession ended, US capacity utilization bottomed at 66.6 percent. It then rose all the way to 79.3 percent in November 2014 and to 79.9 percent in August 2018. Throughout all this, the fed funds rate rose above one percent for only a little over two years and above two percent for a year, before rates began to get lowered again in September 2019. Beginning March 2020, rates have been left zero-bound – again.
Concurrently, the utilization rate has jumped from a low of 63.4 percent in April 2020 to 77.6 percent in January (this year), which was a 34-month high (Chart 4). Rates have not responded higher. Come next month, the Fed will begin a tightening process, but how fast and how high remains the big question mark.
This is the catch-22 for the Fed. For too long, it focused on its jobs mandate, stayed easy and flooded the system with liquidity. The balance sheet ballooned from less than $1 trillion pre-financial crisis and $4.2 trillion in March 2020 to the current $8.9 trillion. By the time it unwinds its bond-buying program, it is likely to hit $9 trillion (Chart 1).
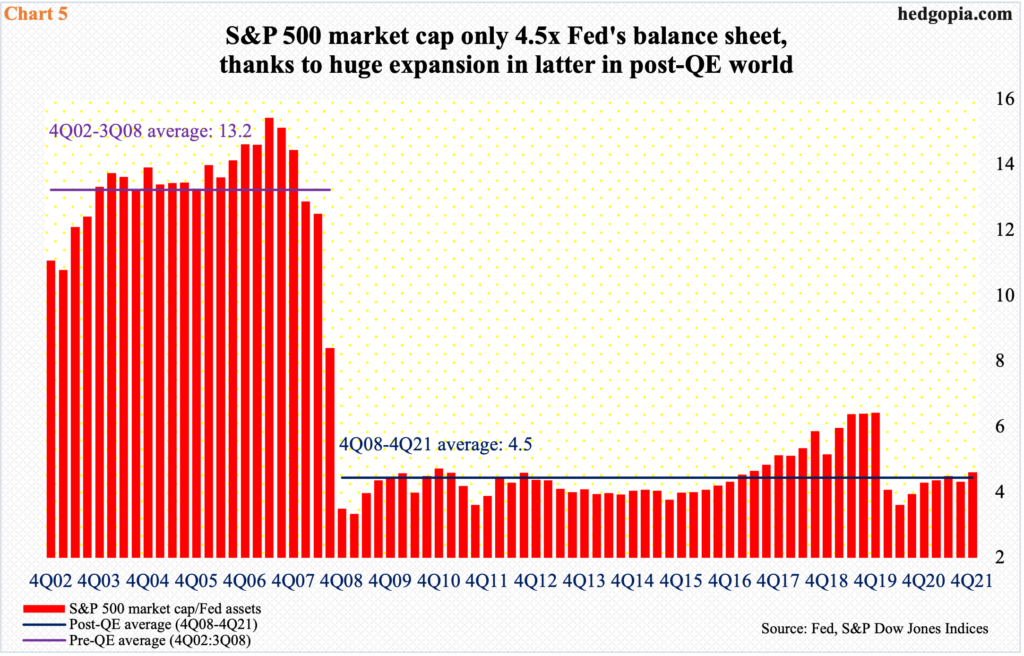
Chart 5 throws light on the excessive buildup of the balance sheet, which is divided into the S&P 500 market cap. The latter was north of $40 trillion in 4Q21, resulting in a ratio of 4.6, in line with the post-QE (4Q08-4Q21) average of 4.5. Before the financial crisis, the ratio was much higher – 13.2 between 4Q02 and 3Q08 – meaning the balance sheet was much smaller then.
Hindsight is always 20/20, but it is now safe to say that all this liquidity played a major role in pushing up inflation to four-decade-old highs.
Now, the Fed wants to focus on its inflation mandate, which is a welcome – but belated – development. The problem is, there is hardly going to be one voice on this within the FOMC. We saw glimpses of potential resistance last week when Kashkari urged his colleagues not to raise rates too fast or too far.
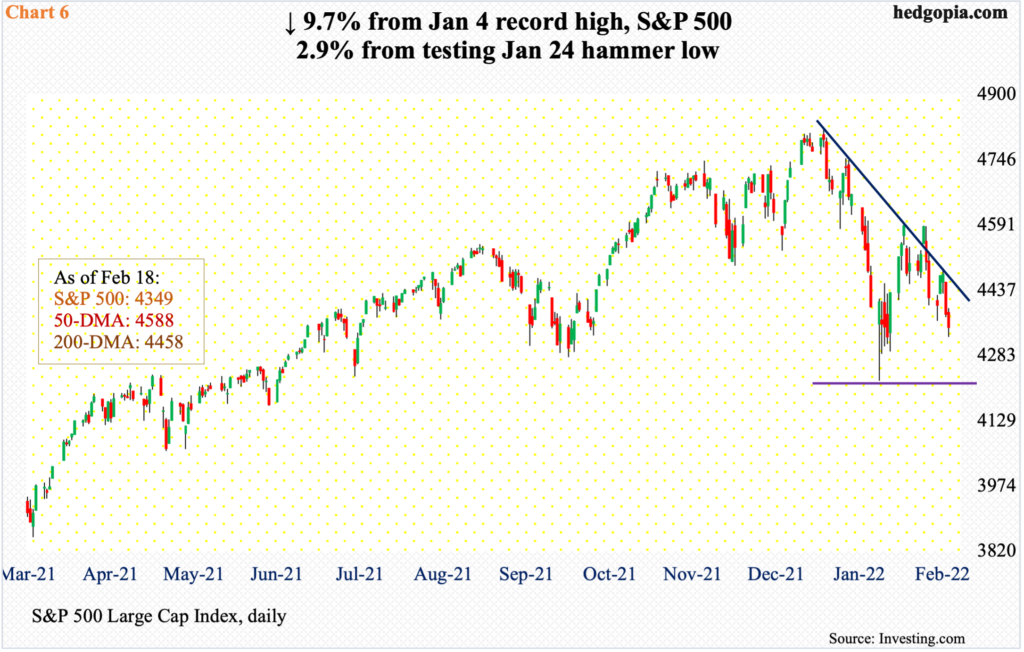
In the end, Bullard’s two-percent prescription could prove to be a wishful thinking. Ordinarily, this is potentially good news for equities. But we are also looking at major US equity indices that until recently were at new highs. From the post-pandemic low in March 2020, the S&P 500 large cap index more than doubled to last month’s fresh high of 4819. Through last Friday’s close (4349), it is down 9.7 percent from that high, and was down as much as 12.4 percent through its hammer low (4223) from January 24.
More downward pressure probably lies ahead. Bulls need to be able to defend last month’s lows. A decisive breach can be taken to mean more investors are beginning to price in a tight tightening cycle, a la Bullard’s prescription.
Thanks for reading!

