
- Equity bulls and bears lock up horns in quest to dictate near-term direction
- Last week’s lows saved on major indices, amidst very bullish engulfing patterns
- VIX once again rejected at/near 17-18; one more opportunity for bulls to take out resistance
 Increasingly, it is looking like technicals are playing a bigger role in deciding the fate of U.S. equities. One would particularly get that impression looking at how they have traded recently. On some level, this should not be too surprising given there is not much news on the earnings front. Not yet anyway. It will begin in earnest next week. Macro-wise, data remain mixed at best. September produced another 200k-plus jobs, but yet again there was a lack of progress on wages. Internationally, Hong Kong is off the headlines, but worrywarts can now agonize over Ebola outbreak. In this environment, equities probably were looking for something to trade off of, and they found that in technicals. To refresh, stocks last week showed signs of at least a near-term bottom. On Thursday, all the major U.S. indices produced a hammer formation, which was confirmed the day after. Monday had higher odds of a follow through, and we were not disappointed. Stocks opened higher but by the close managed to trade lower. Where exactly did that failure occur? At/near important technical levels.
From October 2nd:
“…The SPX, the Dow and the NYSE have broken their respective late-2012 trendlines – the first two this week and the latter in July. The Naz bounced off that trendline yesterday, while the Dow bounced off its late-2011 trendline. This is important, but even more important is this. What the bulls do not want to see happen is a rally attempt that fails at where things broke down – 1960-1965 on the SPX, 10800 on the NYSE, and 17150 on the Dow. The Dow already did a test of its late-2012 trendline last month and failed. That is exactly how things have transpired on the RUT. It broke that trendline in April, tested the underside of it in June, failed and we know the rest.”
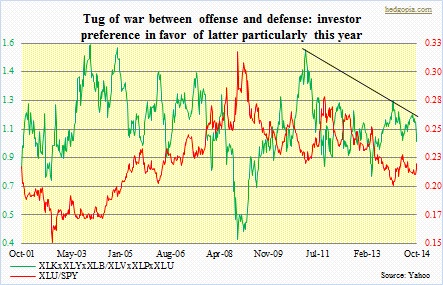
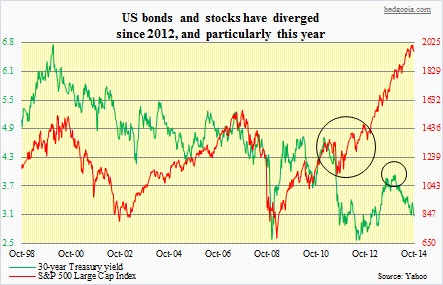 Monday’s rally attempt saw the S&P 500 fail at 1978 (September 24th low), so the aforementioned trendline break is still intact. Ditto with the Dow, as it came up 50 points short of reaching that resistance. The NYSE was 100 points short. The Naz unsuccessfully tried to take out its 50-day moving average. The Russell 2000 Small Cap Index was rejected by its shorter-term moving averages. It is not uncommon to face this kind of resistance given where things are. If things were strong, they probably would have smashed through resistance at the very first go. But they are not. There have been some trendline breaks. Bonds continue to diverge from stocks (adjacent chart), and market participants continue to prefer defensive sectors more than offensives (chart above). And small-caps were acting horrible leading up to the recent sell-off in general. The good thing is, bulls will have another crack at it. Yesterday, things were a little shaky in the morning. But post-release of the FOMC minutes, bids showed up. In the process, the Thursday low never got violated — important technically — matched by bullish engulfing patterns all around. By nature, the more times bulls manage to regroup and hit that resistance from underneath, the higher the odds that it cracks. Fingers crossed.
