
Stocks have rallied massively since March lows, but bulls are essentially hiding in large-caps, and in just a few names within large-caps. If past is prelude, such over-reliance is not lasting.
With 47 companies reporting as of last Thursday, 1Q20 blended operating earnings for S&P 500 companies were $32.36. When the quarter began, the sell-side expected $40.29. The hurdle has been lowered. Companies are still missing. A week ago, these analysts expected $34.71.
That said, in all probability, this is not where investor focus is. The quarter – March in particular – was adversely impacted by COVID-19, and this is not new information. As a matter of fact, the majority may well have written off 2020.
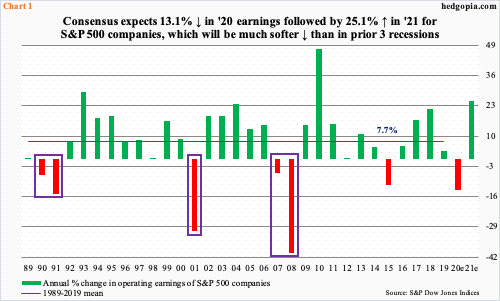
As of last Thursday, 2020 estimates were $136.55. For whatever it is worth, in March last year, consensus was $186.36. This is quite a haircut in sell-side optimism, but they still expect earnings to only drop 13.1 percent from last year’s $157.12. Next year, earnings are expected to snap back strongly with 25.1 percent growth. Whatever!
We know this much. In the last three recessions, earnings contraction was steeper (boxes in Chart 1). The virus-inflicted downturn has the potential to be the worst since Great Depression. If so, earnings will follow.
Stocks are the least bit concerned. Investors either wholeheartedly buy the sell-side optimism about next year’s earnings prospects or some other factors are driving them.
Last Friday, the S&P 500 large cap index jumped 2.7 percent. Thursday evening, news came out that COVID-19 patients at a Chicago hospital responded well to Gilead’s (GILD) remdesivir. The same day, President Trump unveiled federal guidelines for opening up the country, although state governors will make the final decisions. The sooner life goes back to normal, the better. There are no ifs and buts about this. At the same time, hope does not always turn into reality.
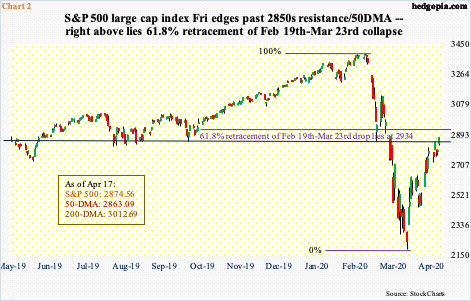
As things stand, optimism remains high. Off the March 23rd intraday low, the S&P 500 is up north of 31 percent. Friday’s rally pushed the index slightly past 2800-2850 resistance as well as the 50-day (Chart 2). Right above at 2934 lies 61.8-percent retracement of the February 19th-March 23rd collapse. Fibonacci followers pay close attention to this sequence, also known as the golden ratio.
The rally in the S&P 500, and others, has come in the midst of one after another dismal economic news. Markets also are anticipatory. They like to look ahead. Judging by the pace at which stocks have rallied off of the March lows, markets expect the spate of bad news currently hitting the economy to soon be behind. Time will be the arbiter of that.
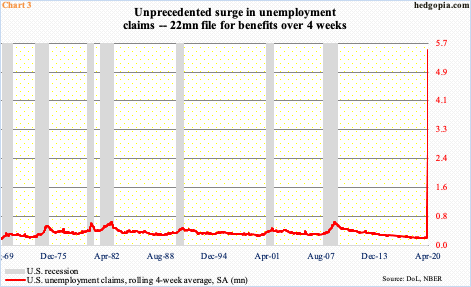
At this moment, the news is abysmal – to say the least. In the four weeks ended April 11th, unemployment claims totaled 22 million, for a four-week average of 5.5 million (Chart 3). This just about wipes out the 20.7 million non-farm jobs created since Great Recession ended in June 2009.
The Fed is trying hard to make sure things do not spin out of control. Once again, time will tell if it will succeed in that goal. Right here and now, equities cherish the fact that the central bank is providing a backstop to a wider group of assets.
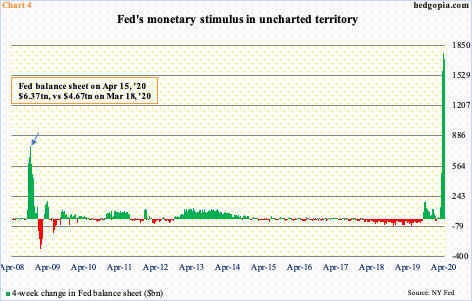
During and after the financial crisis of 2007-2008, the Fed aggressively expanded its balance sheet by buying up Treasury and mortgage-backed securities. Now, it has moved into corporate debt – bond investment-grade and high-yield – and municipal debt.
Market signals obviously get distorted, with a genuine risk of a moral hazard, but the Fed’s action also means an increase in liquidity. In just the last four weeks, its balance sheet went from $4.67 trillion to $6.37 trillion. At the end of last August, it was $3.76 trillion. The current accumulation of assets pales in comparison to what was witnessed during the financial crisis (arrow in Chart 4).
The longer this continues, the harder it becomes for the Fed to eventually walk back. In the end, markets can become numb to central-bank action. This is a longer-term risk. Right at this moment, it is bearing fruit.
Ford (F) last month was downgraded to junk. Thanks to the Fed’s new policy of supporting that slice of the debt market, the automaker last Friday issued $8 billion in debt. Investors were ready to buy as much as $40 billion worth. This helps boost investor confidence – duration and magnitude notwithstanding.
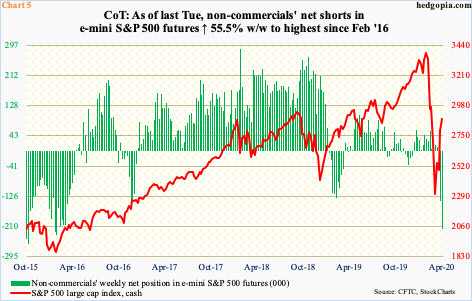
The S&P 500 rallied three percent last week, sitting at an interesting juncture. Should bulls build on last Friday’s action, squeeze odds are decent. As of last Tuesday, non-commercials were net short 217,781 contracts in e-mini S&P 500 futures – a four-plus-year high (Chart 5).
Immediately ahead, what is likely to work in non-commercials’ favor is overbought conditions. The daily in particular is extended.
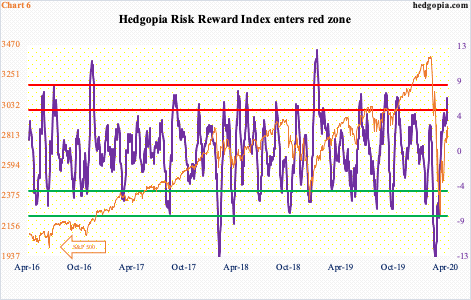
Our own Hedgopia Risk Reward Index just entered the red zone (Chart 6). Designed to capture short-term swings, it has had its share of misfires in the past, but risk-reward probably remains skewed to the downside right now.
Bulls deserve kudos for putting their foot down last month at/near important support. The S&P 500 saved a falling trend line from February 2018 as well as horizontal support north of 2100 going back to February 2015. The Nasdaq 100 defended a rising trend line from the lows of February 2016, even as the Russell 2000 saw bids show up at February 2016 lows.
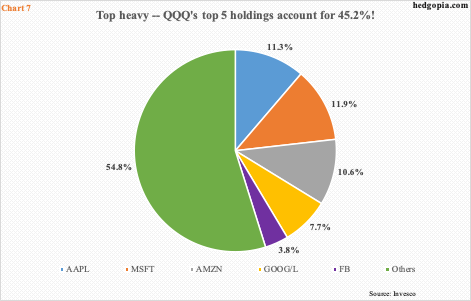
All along, conviction was lacking. Small-caps continued to lag their large-cap peers, and within large-caps, action was top-heavy. Five names – Microsoft (MSFT), Apple (AAPL), Amazon (AMZN), Alphabet (GOOG/L) and Facebook (FB) – currently account for over 45 percent of QQQ (Chart 7). In the S&P 500, their combined share is over 21 percent. In the big scheme of things, such lop-sided reliance tends not to endure over a long period of time.
Thanks for reading!
