
Stocks have done very well this month, pushing the major equity indices into overbought territory. Several other metrics are extended but not extreme. This should give the bulls an opportunity to continue to ride the momentum, but can they pull it off? For starters, they will have to fight off the volatility index that currently sits at five-month support, which likely holds.
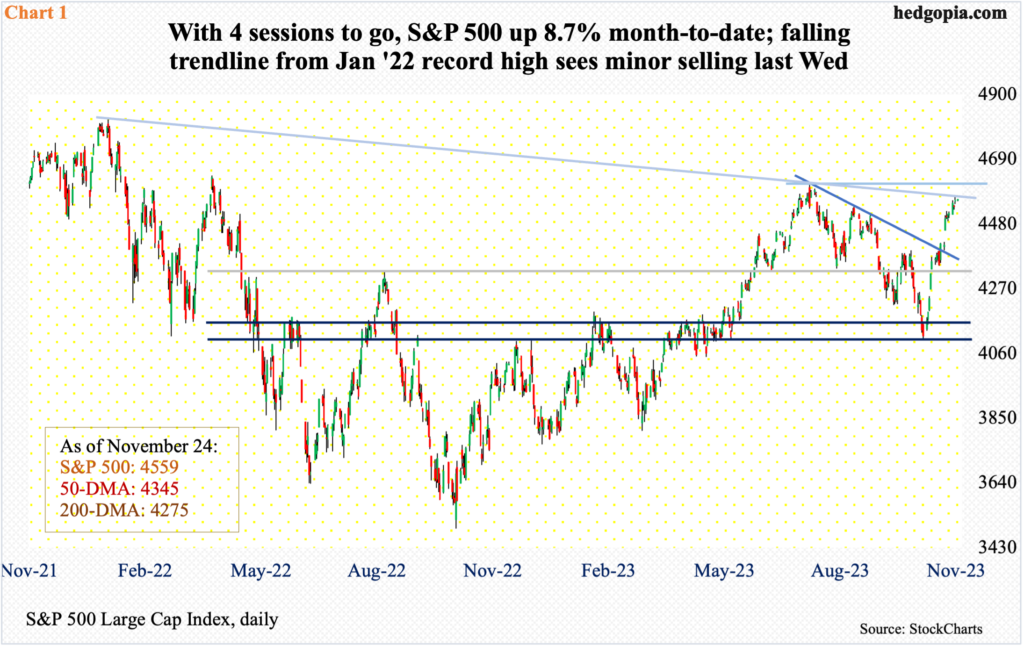
November has been phenomenal for stocks. With four sessions to go, the month has produced a return of 8.7 percent in the S&P 500. This has come after three months of decline. The large cap index tagged 4607 on July 27th and headed lower in the next three months, bottoming on October 27th at 4104.
Earlier, between the all-time high of 4819 reached in January last year and the low of 3492 in October last year, the index tumbled 27.5 percent. Through last Friday’s high, just under 81 percent of that decline has been retraced.
The S&P 500 closed last week 5.7 percent from its record high. For the week, it rallied one percent to 4559. This was the fourth consecutive weekly rise. The July high is one percent away. More important, the index sits just under a falling trendline from the January 2022 high (Chart 1). A breakout here can hurriedly result in a test of the July high. Should that happen, the index gets pushed deeper into overbought territory.
The daily RSI entered the 70s on Monday and remained there throughout last week. The last time this metric has been this strong was in July, which is when the S&P 500 began its three-month decline.
This could easily repeat this time. This is precisely how things evolved last year, with the S&P 500 bottoming in October and rallying until it peaked early December. That said, we are also in a seasonally strong period. Yes, the daily is extremely overbought, but nothing says it cannot remain that way for the foreseeable future. This is going to be a test of bulls’ mettle as to if they can continue to ride the momentum.
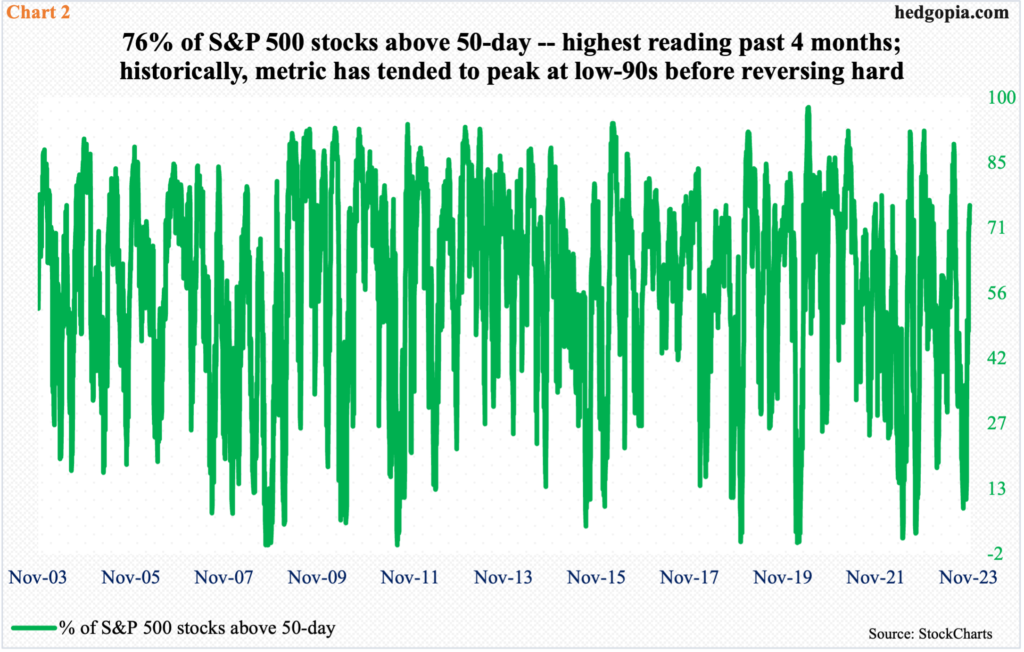
As of last Friday, 76 percent of the S&P 500 stocks were above their 50-day moving average. This is high but can continue higher in the right circumstances for the bulls. Historically, the metric tends to peak in the low-90s. In fact, this was where it was in July, when it printed 89.8 percent on the 24th, before heading lower.
Nevertheless, plenty a time in the past the green line in Chart 2 has retreated from the current level. Once again, equity bulls have an opportunity here to push the metric into extremely overbought territory, but it remains to be seen if they can deliver.
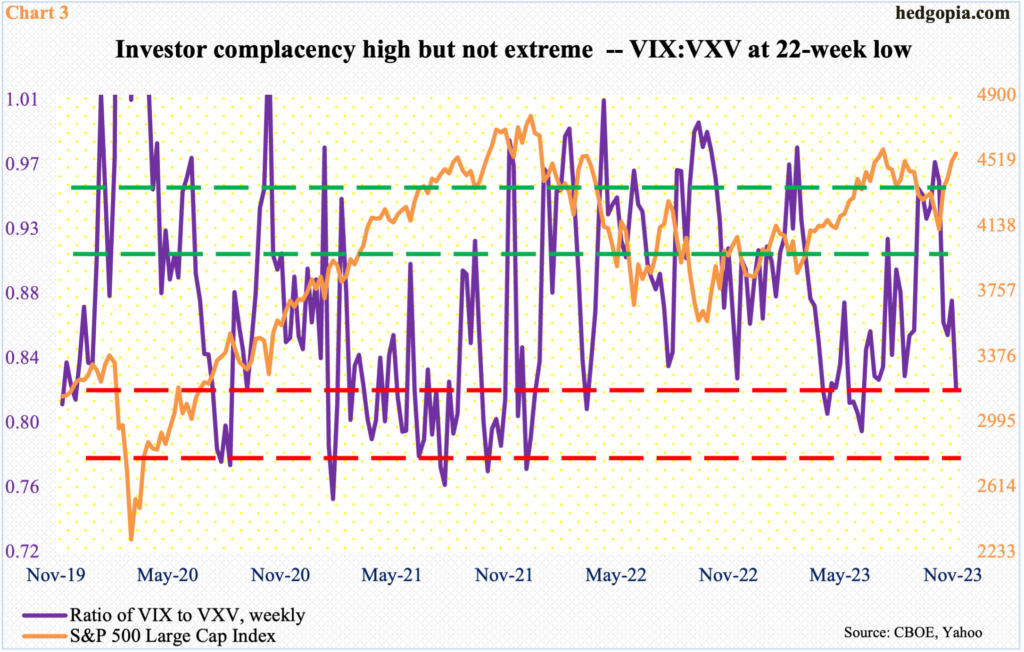
The ratio of VIX to VXV is the same way.
VIX measures market’s expectation of 30-day volatility on the S&P 500. VXV does the same, except it goes out to three months. When the investing climate is risk-on, as has been the case this month, demand for VIX-derived securities is lower than, let us say, VXV. The opposite is true when investor sentiment wanes.
Last week, the ratio of VIX to VXV closed at 0.82 – a 22-week low. The ratio is low enough it can begin to rally anytime (Chart 3), in which case VIX begins to outperform VXV, putting the S&P 500 under pressure.
Here is the thing, though. Extended, yes, but if past is prelude, the ratio has genuinely tended to bottom in the mid- to high-0.70s.
Investor complacency is also beginning to get reflected in sentiment surveys, but, again, there is room to rise further.
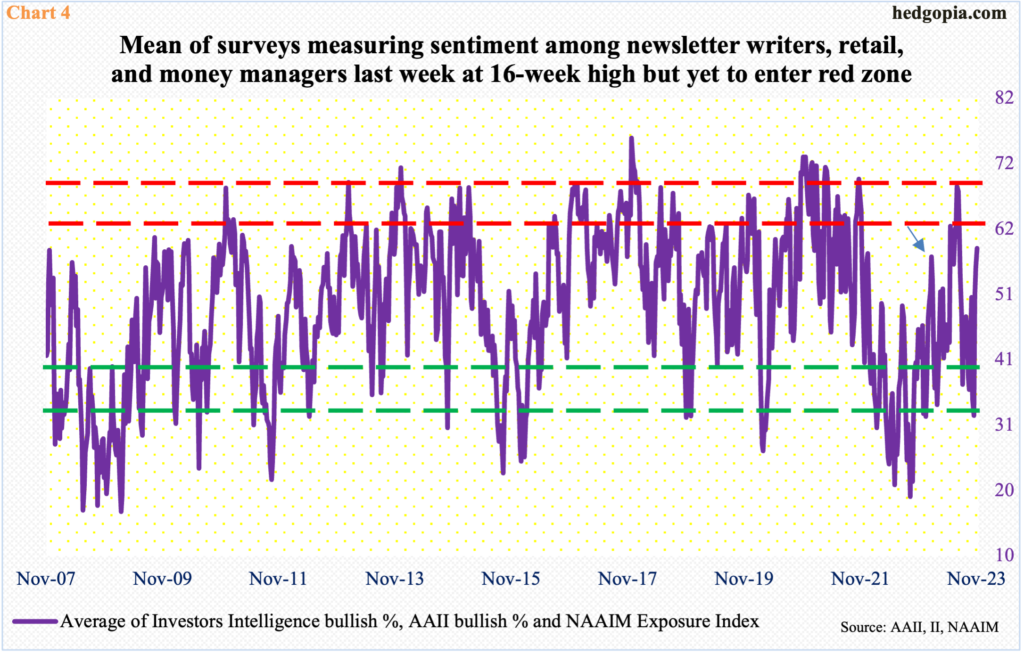
Chart 4 combines three different surveys and takes out an average measuring three diverse groups. Investors Intelligence is a survey of newsletter writers, who cater to paying subscribers. The American Association of Individual Investors surveys its members, so it represents a good reflection on individual mood. And the NAAIM Exposure Index surveys how money managers are positioned, with the index measuring National Association of Active Investment Managers members’ average exposure to US stock markets.
In the week to last Tuesday, Investors Intelligence bulls hit 52.2 percent, matching a high from 15 weeks ago. In the week to last Thursday, AAII bulls reached 45.3 percent, which was a 16-week high. And in the week to Wednesday, the NAAIM index rose to 78 percent – also a 16-week high. The average of the three last week equaled 58.5, which is the highest reading in 16 weeks but is yet to hit the red zone in Chart 4. This yet again points to an opportunity for the bulls if they can pull it off. Else, as the arrow in the chart shows, the metric turned back lower from a similar level in February when the S&P 500 retreated early in that month to remain under pressure for the next six weeks.
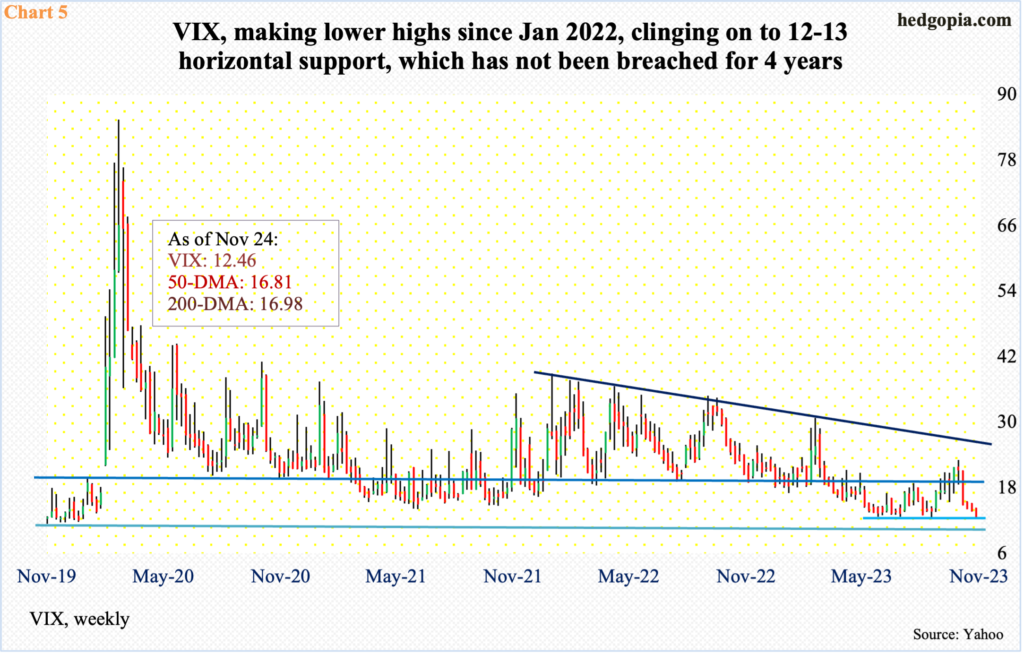
Amidst all this, VIX finds itself at a crucial spot.
The volatility index declined 1.34 points last week to 12.46. This was the fifth week in a row VIX suffered a down week, having tagged 23.08 on October 23rd and reversed lower.
Last week’s drop has landed VIX at horizontal support of potential importance. It has bounced off the current level several times in the past five months (Chart 5). In fact, the support has not been breached for four years. A breach – should one occur – opens the window for VIX to go lower toward 11-12 and will obviously bring bad news for volatility bulls and good news for equity bulls.
Should volatility bulls put their foot down and VIX rallies – which is the path of least resistance as things stand – equity bulls should have another opportunity in the coming weeks to regroup to play the Santa rally.
Thanks for reading!
