
The bull market is more than a decade old. Several metrics are at/near record territory. The energizer bunny keeps marching on. In recent sessions, bulls have faced difficulty taking out 3020s and may need to defend breakout retest at 2940s.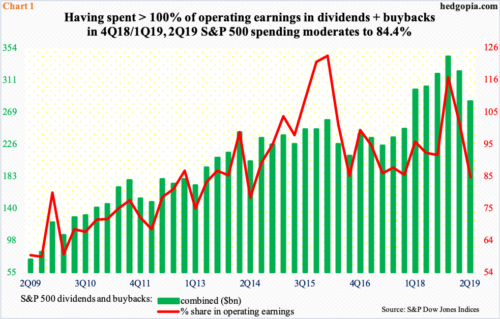
The bull market is in its 11th year. This has been the longest run in US history. The S&P 500 large cap index (2992.07) bottomed in March 2009 (676.53 on a closing basis on the 9th and 666.79 intraday on the 6th). As the bull is aging, dividends and buybacks have acted as a source of tailwind.
In 2Q19, cash dividends per share paid out by S&P 500 companies were $14.24 – a new high. On an absolute basis, $118.7 billion was distributed, which is slightly below record $119.8 billion set in 4Q18. Also in 4Q18, at $223 billion, buybacks set a record, before dropping to $205.8 billion in 1Q19 and $164.5 billion in 2Q19.
Chart 1 plots a sum total of dividends and buybacks against their share in operating earnings. In 2Q19, for instance, earnings were $335.6 billion. At a combined $283.2 billion, dividends and buybacks made up 84.4 percent of this, which is already very high, not leaving much for capital expenditures. As a matter of fact, in 4Q18 and 1Q19, the share of dividends and buybacks exceeded 100 percent – 116.7 percent and 102.1 percent, respectively. This is unsustainable.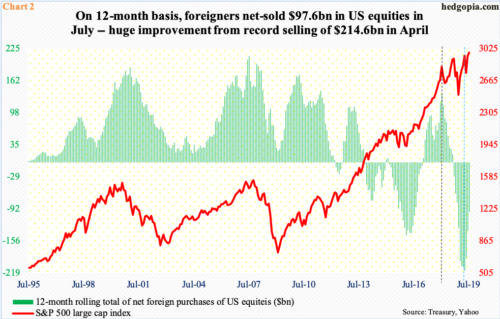
One interesting aspect to all this is how foreigners are behaving. Up until recently, they were beginning to act as if the bull was on its last legs, not taking advantage of pullbacks. In January-February last year, the S&P 500 suffered a quick two-week, double-digit decline. In January, the 12-month total of foreigners’ net purchases of US stocks peaked at $135.6 billion (black vertical dashed line in Chart 2). Since then, the S&P 500 has trended slightly higher, with a few more decent pullbacks, including the one in October-December last year. Even after the index bottomed last December, foreigners kept reducing exposure to US stocks. In April this year, they sold $214.6 billion worth – a record (blue vertical dashed line).
Come June as well as late July-early August, the S&P 500 once again briefly sold off. This time around, foreigners acted a little different, with a reduced pace of selling. As a matter of fact, after 13 consecutive months of selling, they were net purchases in both June and July, for a combined $50.6 billion. In July, the 12-month total of selling was down to $97.6 billion.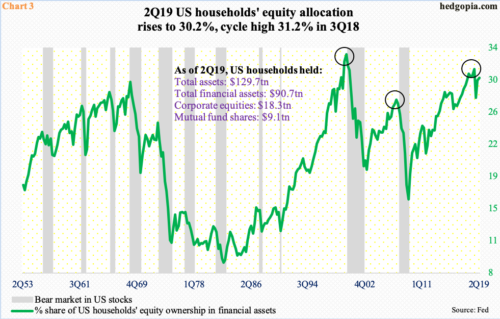
It is too soon to say if foreigners are warming up to US stocks. We will know more once August data come out in three weeks. If indeed a sentiment shift has occurred, this would have come at an interesting juncture. Several valuation metrics are at/near uncharted territory. Last Friday’s post (here) talked about the elevated ratio of S&P 500 market cap to nominal GDP. Chart 3 sheds light on another.
In 2Q19, US households’ equity allocation rose to 30.2 percent, versus the cycle high 31.2 percent recorded in 3Q18, which was well beyond the prior cycle high of 27.7 percent in 2Q07 and just below the all-time high of 32.9 percent in 1Q00 (circles).
These are elevated levels. At least going by the prior two cycles, stocks take it on the chin once unwinding begins in earnest, which makes what is transpiring in the land of margin debt pertinent.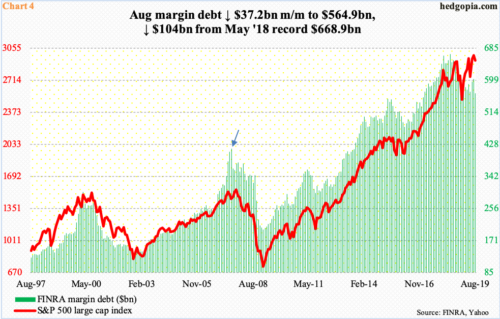
Historically, FINRA margin debt and the S&P 500 tend to move hand in hand (Chart 4). There has been a divergence of late.
Margin debt peaked in May last year at $668.9 billion. From that record high through August this year, it is down $104 billion, to $564.9 billion. The S&P 500 is merely 1.2 percent from the record high set on July 26. In fact, intraday last Thursday, it was within 0.2 percent of that high.
For more than a year now, longs for the most part have hesitated to take on/add to margin debt during pullbacks. For whatever it is worth, before the S&P 500 peaked in October 2007, margin debt was already on its way down, having peaked in July that year (arrow).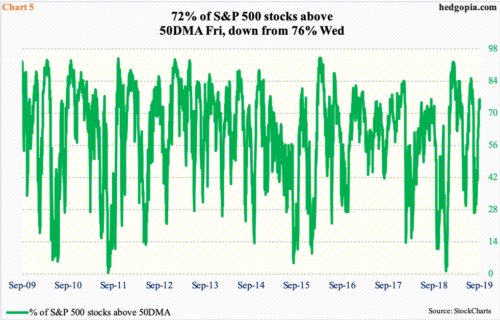
These are medium- to longer-term concerns. As things stand, several other metrics of shorter duration are extended as well.
Last Friday, 72 percent of S&P 500 stocks were above their 50-day moving average. Wednesday, they rose as high as 76 percent. With that said, plenty of times in the past this metric has gone on to rise until it hits the ceiling into the 90s, which is rate (Chart 5). More often than not, it tends to peak in the 70s/80s.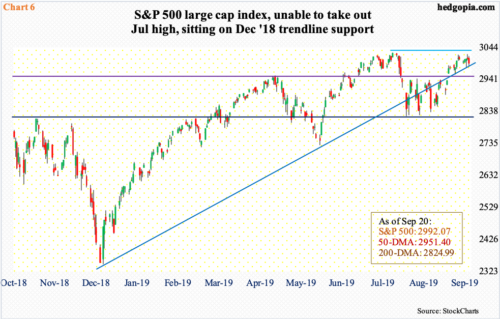
Last week, the S&P 500 shed 0.5 percent. This followed three up weeks. Seven sessions ago Thursday, the index retreated from 3020.74 in a long-legged doji session. Thursday last week, it pulled back after printing 3021.99 intraday. This is an important price point. On July 26, the index made an all-time high of 3027.98. Last Wednesday, a potentially bearish hanging man also formed on the daily, with the session low finding support at a rising trend line from last December. In the past couple of weeks, bulls have used this support to buy (Chart 6).
Near term, odds favor continued unwinding of prevailing overbought conditions. The index is essentially sitting on the afore-mentioned trend line. A break opens the door to a test of horizontal support at 2940s. The 50-day (2951.40) lies around there as well. Twelve sessions ago, after getting rejected at 2940s throughout August, the S&P 500 broke out. The best bulls can hope for right now is a successful breakout retest so they can regroup and go after the July high again. The worst is a test of important support just north of 2800.
Thanks for reading!
