
Bulls continue to defend 2600-2630 on the S&P 500. Breach risks are rising. VIX, which since October has stayed rather elevated, is itching to rally.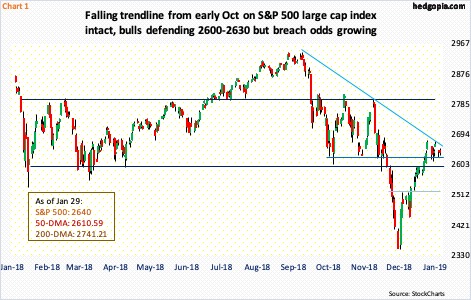
After a three-month, 20-percent drop, the S&P 500 large cap index (2640) bottomed intraday on Boxing Day. It then quickly rallied 14 percent, on its way to recapturing in the middle of this month 2600, which was the lower bound of a rectangle that the index was in for most of last year (Chart 1). The upper bound lies at 2800.
Bulls retook 2600-2630 alright, but they have struggled to build on it. In five of the past six sessions, bids showed up at that support. Buying power has been expended. The 50-day (2610.59) lies right there. Momentum is decelerating. The daily in particular is deeply overbought. Risks of a breach of the support are rising.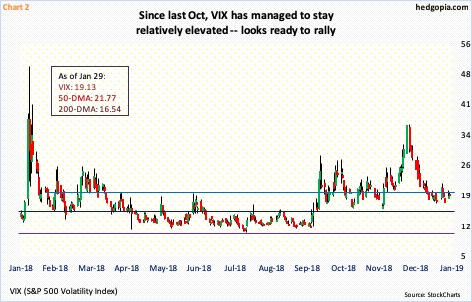
VIX is itching to rally.
Since early October, when the S&P 500, and US stocks in general, quickly unraveled, the volatility index has had its share of ups and downs, but at a higher plateau (Chart 2). Since October 11, only once has VIX gone sub-16 – on December 3, and this, too, was intraday not close.
On December 26, when the S&P 500 bottomed, VIX (19.13) rose intraday to 36.20, but only to reverse. The drop since cost it the 50-day (21.77), but not the 200-day (16.54). Both these averages are flattish. Importantly, the daily MACD is on the verge of a potentially bullish crossover.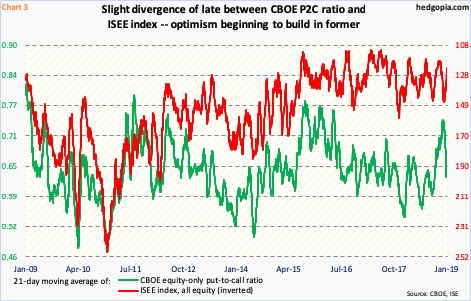
Elsewhere in the options market, signals are mixed, but one metric in particular has unwound quite a bit of the oversold condition it was in.
Chart 3 plots the 21-day moving average of the CBOE equity-only put-to-call ratio and the ISEE index, all equity. The latter is a call-to-put ratio, hence inverted. Of the two, the ISEE index is considered a cleaner number. It excludes trades from market makers and brokers/dealers. It also only uses opening long trades. Market makers, for instance, need to hedge exposure all the time. Retail traders, on the other hand, bet on direction. Historically, the green and red lines in the chart tend to move together. This time around, there has been a slight divergence.
On Christmas Eve, the CBOE put-to-call ratio rose as high as 0.744 – the highest since May 2016 – before reversing. The S&P 500 bottomed one session later. Last Friday, the put-to-call ratio touched 0.626, with Tuesday this week at 0.63. The ISEE index, however, has come under pressure in the past three weeks, even though the S&P 500 continued its uptrend. Right here and now, the CBOE put-to-call ratio has gotten it right. Ideally, it tends to bottom in high-0.50s/low-0.60s. From its late-December high, it has come down quite a bit.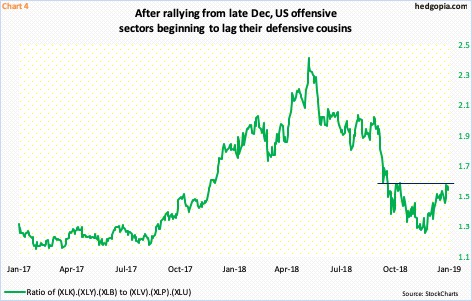
Concurrently, it is possible the ratio of offensives to defensives in Chart 4 has hit the wall. Six SPDR sector ETFs are used for this purpose. XLK (technology), XLY (consumer discretionary) and XLB (materials) are considered offensive, and XLV (health care), XLP (consumer staples) and XLU (utilities) defensive.
The ratio bottomed at 1.21 on December 21 – a couple of sessions before the S&P 500 did – before rising to 1.53 last Friday. Resistance around here goes back nearly four months. Tuesday, it dropped to 1.49.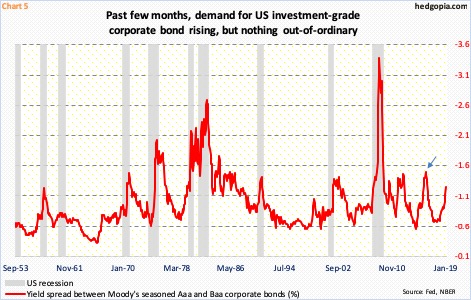
Interestingly, despite a 20-percent drop on the S&P 500 in October-December, there was no panic in the corporate credit market.
As of Monday, the yield spread between Moody’s Aaa and Baa corporate bonds stood at minus 1.24 percent. It has been rising since September 2017 from minus 0.67 percent. Back in December 2016, ahead of a major low in stocks in February 2016, the ratio rose as high as 1.49 (arrow in Chart 5). As panic spreads, demand for Aaa bonds – the safest in the corporate world – rises, even as money comes out of Baa bonds, which are at the bottom of the investment-grade rating. This is yet to earnestly occur.
This in and of itself does not mean stocks need to digest their recent gains, but several other indicators above suggest as much. Once 2600-2630 is lost, bulls need to save 2520 on the S&P 500 (Chart 1).
Thanks for reading!
