
The energizer bunny marches on. The U.S. consumer, that is.
In the third quarter, the U.S. economy grew an annualized 1.5 percent. This was the first estimate, so it probably gets revised up or down by the time we have the final reading in two months.
As of October 28th, the Atlanta Fed’s GDPNow model was forecasting a 1.1 percent real GDP growth.
The economy slowed down from the 3.9 percent pace in the second quarter. The ‘change in private inventories’ category subtracted 1.44 percent from the GDP print.
But the real highlight was the consumer. They continue to do the heavy lifting.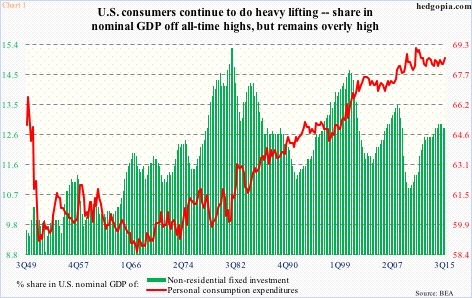
In Chart 1, personal consumption expenditures (PCE) have been pitted against non-residential fixed investment. The difference in behavior could not be starker.
In 3Q15, PCE’s share in nominal GDP was 68.6 percent, which has backed off a tad from the all-time high of 69.1 percent in 1Q11, but has firmed up since 68.2 percent in 3Q14. In contrast, the green bars have been going the other way – from 12.9 percent to 12.8 percent.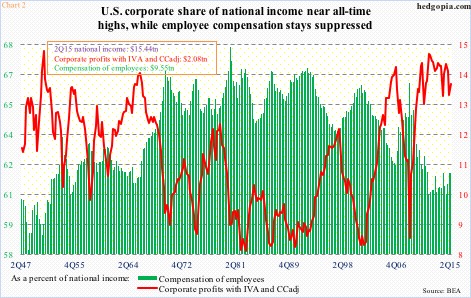
The behavioral difference between business and consumer is particularly interesting given what is going on in Chart 2. In the current cycle, as a percent of national income, the red line has performed way better than the green bars. The share of corporate profits (adjusted for inventory valuation and capital consumption) shot up to 14.5 percent in 4Q11, dropping to 13.5 in 2Q15, but remains highly elevated versus past cycles.
To say that employees are receiving the short end of the stick will be no exaggeration. Real incomes are stagnant. Annual increase in average hourly earnings (nominal) of private employees has been stuck at the two-percent range throughout the current recovery. The last time earnings grew with a three handle was in April 2009 (Chart 3).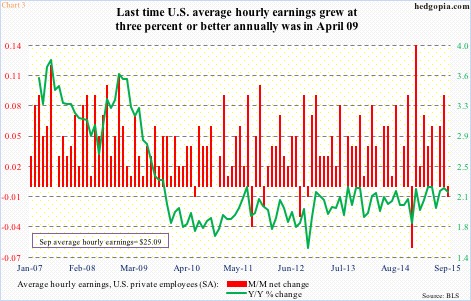
From this perspective, it is counterintuitive to see consumers continuing to maintain a healthy level of spending, even as businesses take a cautious attitude toward capital expenditures. In six of the past eight quarters, real PCE has grown with a three handle (annualized), with the remaining two growing one-plus percent. In 3Q15, it grew 3.2 percent; non-residential fixed investment increased 2.1 percent.
The Fed’s zero interest-rate policy has gone a long way in lessening creditors’ pain – be it consumer or business.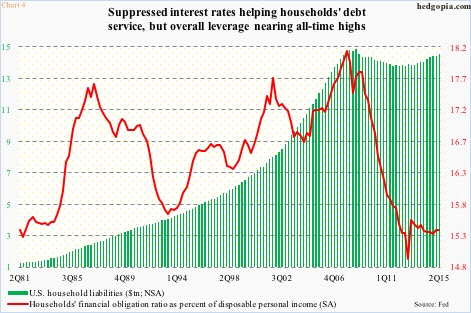
The red line in Chart 4 represents households’ financial obligation ratio as a percent of disposable personal income. From 4Q07 to 4Q12, it dropped from 18.13 percent to 14.93 percent, before inching higher, with 2Q15 at 15.28 percent. These are historically low levels, and from the perspective of consumers’ balance sheet, their significance cannot be emphasized enough.
Look at the green bars in Chart 4. Despite what we constantly hear of ongoing deleveraging by consumers, at $14.3 trillion, household liabilities in 2Q15 were a mere two percent away from the peak in 3Q08. True, mortgage credit is lower, but consumer credit in particular is through the roof, particularly the past five years (Chart 5).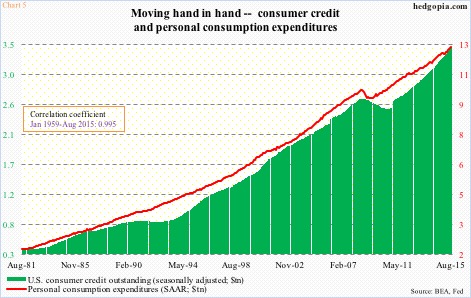
Here is the kicker! In Chart 5, the correlation between the two variables is near-perfect. The taller the green bars get, the higher the susceptibility to interest rates. Hence the significance of the red line in Chart 4, and by default the ZIRP.
Interest rates will have to stay lower for longer. The Fed may or may not move in December – probably not – but even if it moves, it lacks the flexibility to continue to try to fill its monetary quiver with interest-rate arrows.
Thanks for reading!
