
- As world’s largest debtor and one running deficit, U.S. needs constant demand for Treasurys
- Recycling of petrodollars has been reliable source of demand for U.S. federal debt
- So far, drop in price of crude has not adversely impacted this demand
U.S. national debt has come a long way – from less than $6tn in 2000 to just north of $18tn (Chart 1). In seven years (since 2007), the debt load has doubled. Naturally U.S. Treasury securities outstanding has kept pace – from under $3tn in 2000 to $12.5tn now (Chart 2). Although the pace of issuance has decelerated since 2010.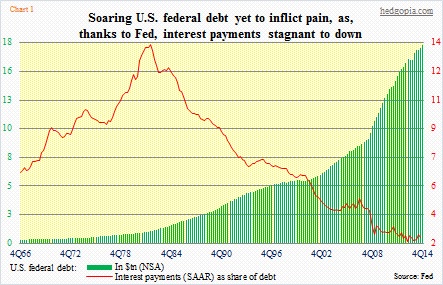
Despite this humongous amount of debt, we have not had any dramatic repercussions yet. Post-financial crisis, the Fed not only pushed the Fed funds rate to near zero but also instituted QE which artificially suppressed rates on the long end of the curve. This has gone a long way in reducing interest payments on that debt. Notice the red line in Chart 1. God help us when rates start rising. Whenever that is!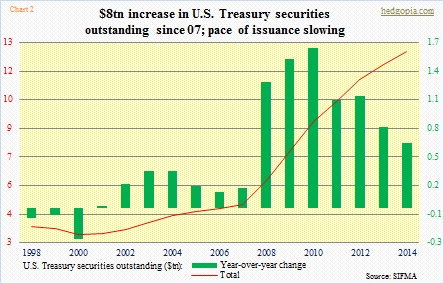
The other concern of course is whether or not there would be continued availability of willing buyers of these Treasurys. Especially given that debt has continued to pile up. So far, this has not been a problem.
As a matter of fact, smaller federal deficit has caused smaller issuance in Treasurys. Form April 2009 to February 2013, the 12-month running total of U.S. deficit persistently stayed north of $1tn. This has improved to -$436bn in November, which was the lowest since August 2008. Which obviously means the need to issue debt is much less versus back then. The 12-month rolling issuance of Treasury notes and bonds was $767bn in December last year – the lowest since April 2009 (Chart 3).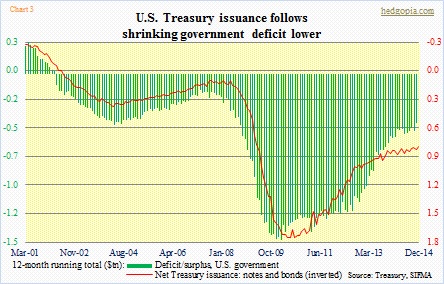
Nonetheless, Treasurys will continue to be issued.
The Fed is no longer buying (by the way, it is sitting on $2.3tn worth of notes and bonds). So anytime signs emerge of risks for disruption to this steady supply of buyers, it grabs attention, as it should. What is transpiring in the oil patch is one such potential out-of-left-field development. Oil exporters have been actively recycling their dollars into Treasurys. Price of crude has dropped more than 50 percent in seven months, and this is bound to disrupt many an oil exporter’s budget dynamics. Hence the fear that they may not only stop purchasing Treasurys but may start selling them in order to raise funds for their domestic needs.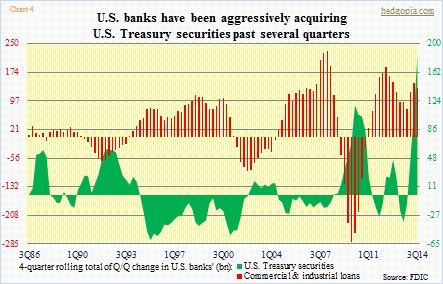
By the way, before we get to oil, here is an interesting trend among U.S. banks. In the past, their Treasury purchases have moved inversely with commercial and industrial loans (Chart 4). The more they give out in loans, the fewer Treasurys they purchase. But this time around, they have been doing both. True, C&I loans are not going gangbusters. In 3Q13, they grew 6.7 percent year-over-year, to $1.67tn. Nonetheless, they are growing. At the same time, these banks have also been loading up on Treasury securities. At 3Q13, they had $159.7bn worth, and by 3Q14 this had ballooned to $345.5bn. Interestingly, this has come at a time when their economists and strategists have all been uniformly expecting long rates to rise! Talk about not putting money where your mouth is.
Now on to oil.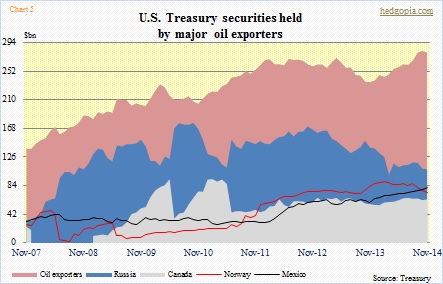
Chart 5 shows the role of petrodollars in demand for Treasurys. In the monthly Treasury International Capital report, the category ‘oil exporters’ (OPEC) held $40-plus-billion worth of Treasurys in early 2000. By November, this had surged to $279bn. Russia was $8bn in January 2007 and $108bn in November. Norway was $2bn in March 2007 and $74bn in November. Mexico was $17bn in February 2000 and $81bn in November, and Canada was $19bn and $64bn in that timeframe. Cumulatively, these five held $250bn worth of Treasurys in 2007 versus $606 as of November last year. Of course, this is nowhere near what Japan ($1.24tn) and China ($1.25tn) hold, this is a sizable total.
Hence the rise in concern over potential drop in demand for Treasurys from this source. Cumulatively, there is no sign yet of this happening. Their combined total peaked in September last year at $621bn, and has dropped by a little over $13bn. A big portion of that drop came from Russia and Norway. Incidentally, they both peaked much earlier than crude oil began to collapse in June last year. Russia has been reducing its Treasury holdings since October 2010 ($176bn). Norway’s peaked at $90bn in February last year. OPEC, which could be the swing factor, is holding on.
No worries for now.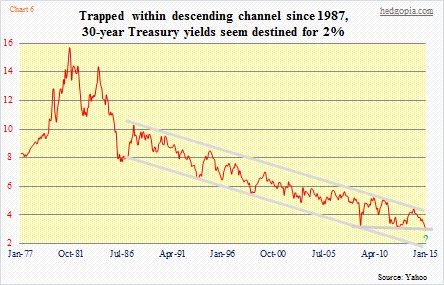
Nor are bond vigilantes. The 30-year yield just made an all-time low of 2.35 percent last week, and could be headed higher in the near term. Technicals are way too oversold. As Chart 6 shows, the 30-year has been trading within a descending channel for 27 years now, and the low end of that lies around two percent. This is a level that in due course may very well act like a magnet. Unless of course oil throws a monkey wrench in the works.
