
Since last October’s bottom in stocks, trillions in additional wealth have been added. Prices headed north, even as earnings headed south, helping push up multiples. This also makes equity bulls, who are sitting on loads of paper profit, jittery, as was evident in last Thursday’s bearish engulfing candle on several major US equity indices.
Equity bulls deserve kudos for having rallied stocks as far as they have. Yes, conditions – technical, sentiment, and what have you – were panicky when they bottomed last October, which laid the foundation for the upturn that followed. But the upward momentum has continued much farther than even the early bulls probably expected – now well into overbought territory on several metrics.
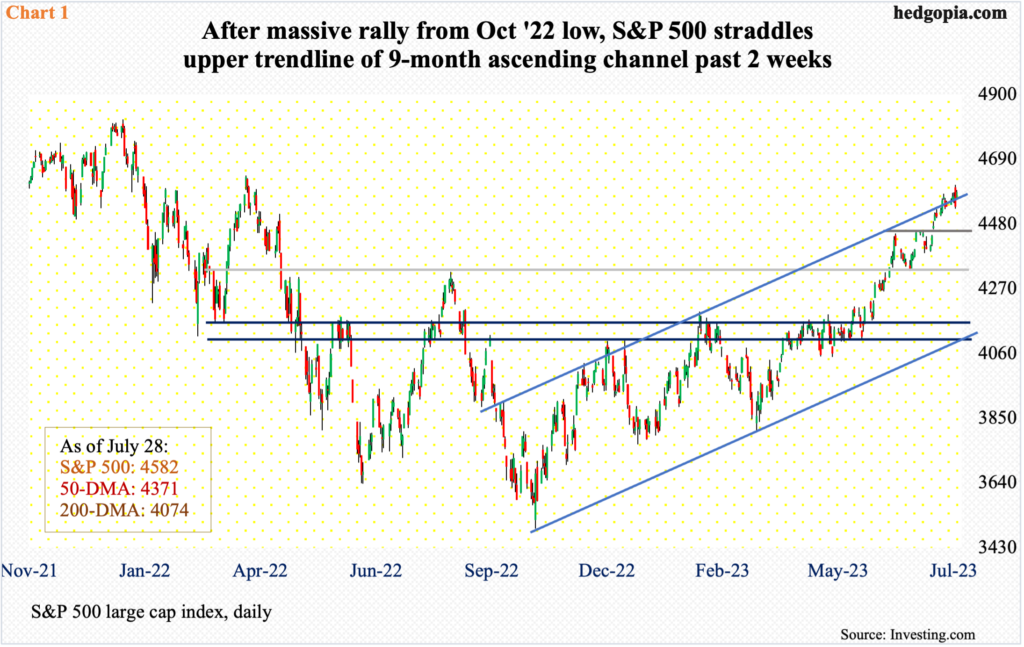
From the October 13th trough through last Thursday’s intraday high of 4607, the S&P 500 index jumped 31.9 percent. Before that, it fell 27.5 percent from the January 2021 high. At 4582, it is currently 5.2 percent from that high, which is not a lot given how June and July fared. The large cap index surged 6.5 percent in June and is up three percent in July with one session to go.
The rally went into overdrive once 4100 fell, and this was in April. After that in June fell 4320s, which was a high from last August. Most recently, on the 12th (this month), there was a mini-breakout at 4450s. For the past couple of weeks, the index has gone back and forth around the upper bound of an ascending triangle from last October’s low (Chart 1).
Last Friday, the S&P 500 poked its head out of that channel resistance, but not decisively, particularly considering Thursday’s massive bearish engulfing candle. As a matter of fact, thanks to Friday’s one-percent rise, bulls were able to deny bears of yet another potentially bearish weekly candle. Until Thursday, the index was on track for a weekly gravestone doji. This would have come after a shooting star in the prior week.
This week, with reports from Apple (AAPL) – the largest weight in both the S&P 500 and the Nasdaq 100 – and Amazon (AMZN) on Thursday, a lot is at stake with odds on the rise for bears to make inroads.
Immediately ahead, there is decent support at 4450s, followed by 4320s.
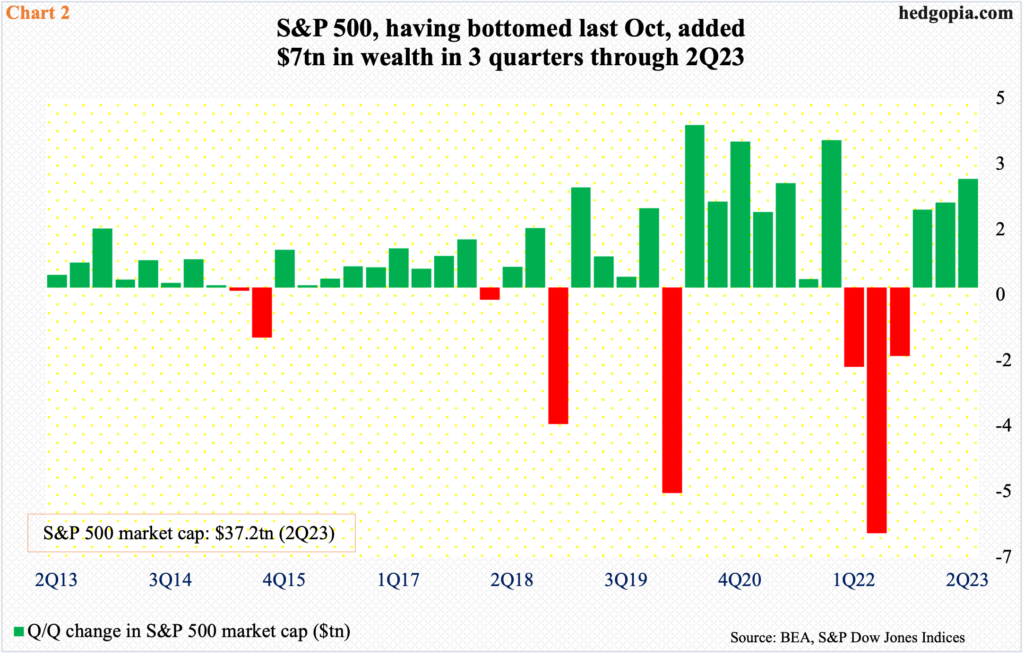
The 32-percent rally from October – over less than 10 months – has obviously created a lot of wealth.
At the end of last September, the S&P 500 had a market cap of $30.1 trillion. Three quarters later – that is, at the end of June – this had swollen to $37.2 trillion, adding north of $7 trillion (Chart 2). As things stand, this has gone up by another three percent July-to-date; this, however, is still not sufficient to surpass the record high $40.4 trillion from 4Q21, which was just before the index peaked in January the following year at 4819.
But the fact remains that the $7 trillion in additional wealth goes a long way in boosting consumer confidence, not to mention consumption. In July, the University of Michigan’s consumer sentiment index jumped 7.2 points month-over-month to 71.6 – a 21-month high. In June last year, confidence hit a record low 50. This has been a huge tailwind to the economic momentum in the last few quarters.
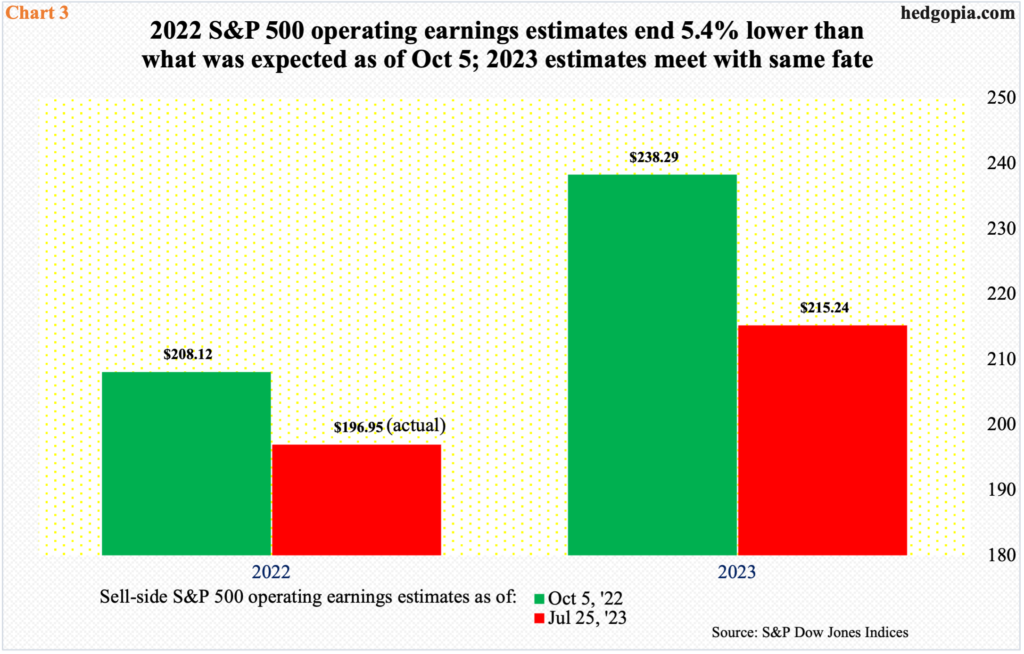
This is taking place at a time when earnings expectations have been persistently revised lower.
Just ahead of last October’s bottom in stocks, as of the 5th that month, S&P 500 companies were expected to earn $208.12 in operations in 2022. The sell-side had already been cutting their numbers, which peaked at $227.51 as of April 27th that year. They kept cutting. When it was all said and done, 2022 brought home $196.95, down $11.17 from when stocks bottomed (Chart 3).
Similarly, 2023 estimates were $238.29 as of October 5th last year. Same as last year, 2023 estimates peaked last April at $250.12. As of last Tuesday, the sell-side has penciled in $215.24 for this year, which represents a decrease of $23.05 from last October.
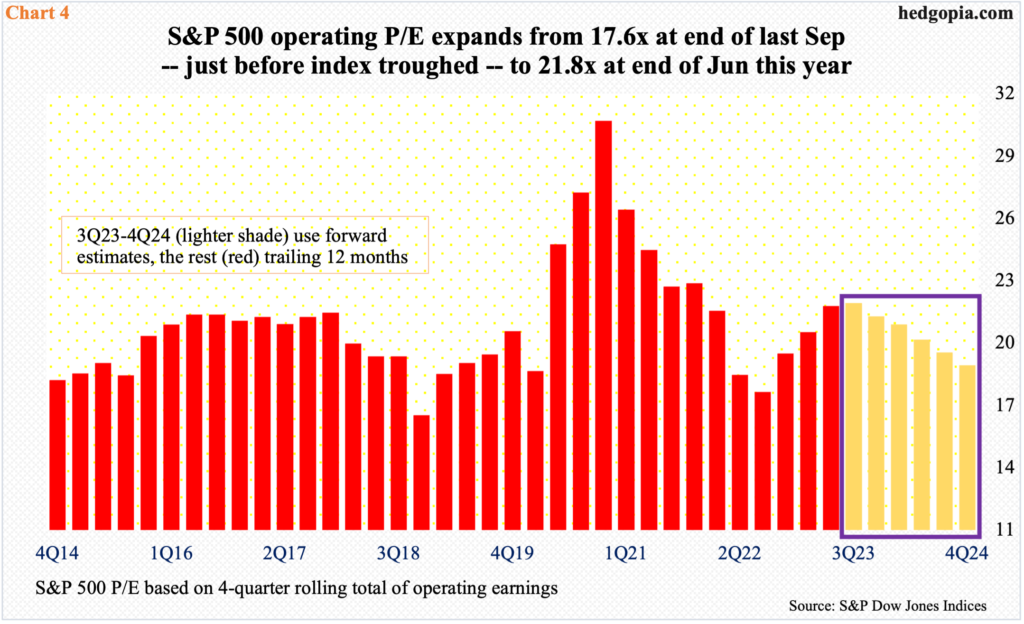
A combination of higher prices and lower earnings has pushed up valuations – meaningfully.
Chart 4 calculates an S&P 500 operating price-to-earnings ratio using a four-quarter rolling total of earnings – both trailing and forward. The six lighter-color bars on the right of the chart use forward estimates, the rest are based on actual trailing earnings.
At the end of September, which was two weeks before stocks bottomed last year, these companies brought home $203.31 in operating earnings over four quarters, for a P/E of 17.6x. Three quarters later – that is, by the end of June this year – 2Q23 blended earnings of $204.37 have grown only minimally, even as the S&P 500 shot up. The P/E ratio, therefore, jumped to 21.8x.
Companies are still reporting second-quarter earnings. As of last Tuesday, 46 percent had reported, with earnings coming in at $51.11. If the number gets revised lower as the season progresses, the 2Q23 P/E rises further. The multiple improves in the quarters ahead, but it is based on what probably is pie-in-the-sky forecast. The sell-side currently expects $242 for next year, up 12.4 percent from this year’s expected $215.24. In 2022, $196.95 was rung up.
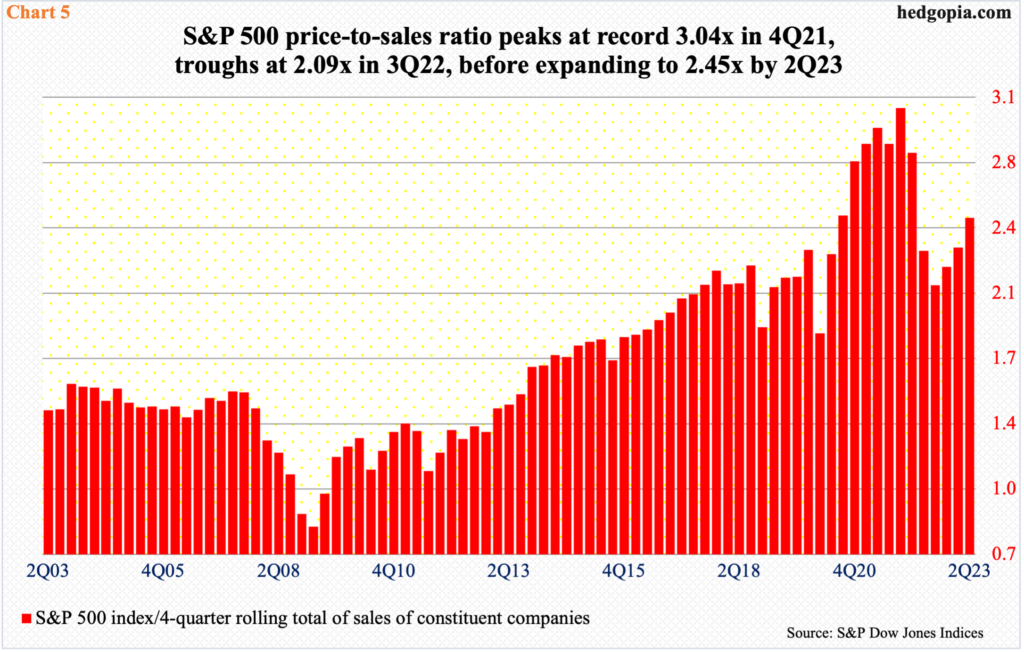
Equity bulls can take solace in the fact that valuations using the top line looks better, but even here the multiple looks stretched using history as a guide.
In 4Q21 – just before the S&P 500 reached a record high in January 2022 – the price-to-sales ratio hit 3.04x, which was a fresh record. The ratio then came under pressure, bottoming at 2.09x in 3Q22. Forget the financial-crisis low (0.8x) reached in 1Q09, the ratio troughed at 1.83x post-Covid in 1Q20. So, the ratio far from bottomed at a throwaway price in 3Q22, and has reached 2.45x by the end of June (Chart 5).
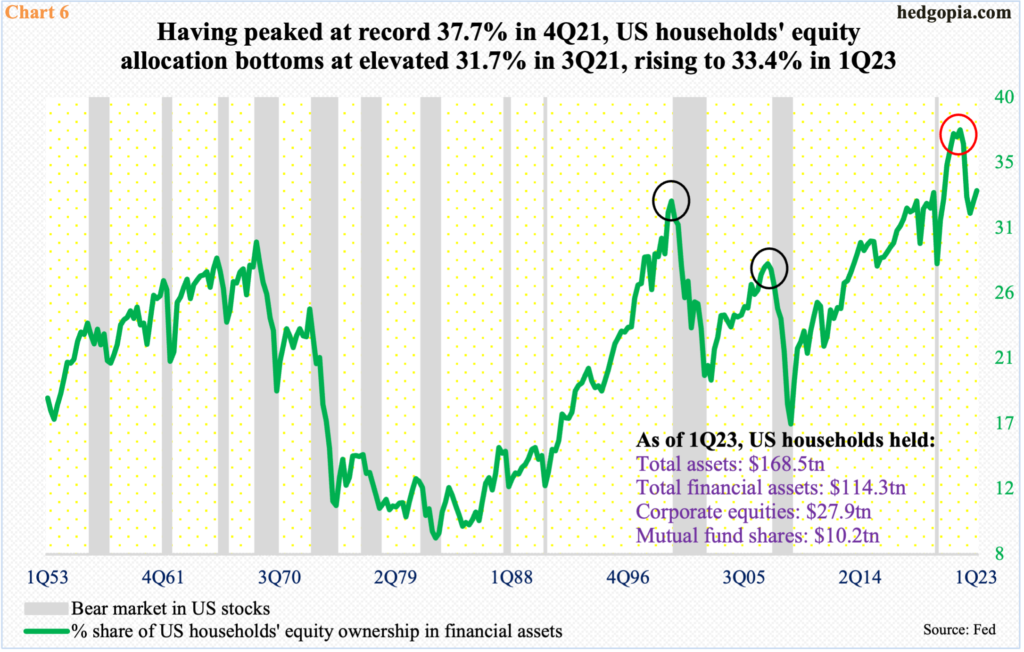
The metric in Chart 6 acts similar. US households’ equity allocation reached a record 37.7 percent in 4Q21. Once again, this was just before the S&P 500 peaked, although both the Russell 2000 small cap index and the tech-heavy Nasdaq 100 index peaked in November 2021.
After that peak, the green line in the chart quickly dropped six percentage points to 31.7 percent by 3Q22, before once again rising, reaching 33.4 percent in 1Q23. This data point comes with a lag, so 2Q numbers will not be out for another couple of months.
That said, the S&P 500 surged 8.3 percent in the second quarter, so it is safe to assume that the green line has pushed much higher. Except for the 4Q21 peak, the 1Q23 reading is already higher than either the 1Q00 or 2Q07 peaks (black circles). Things are stretched.
It is at a time like this that sentiment can act jittery. Longs are sitting on tons of profit and no sane one would like to see it cut, let alone vaporize. Increasingly, this phenomenon can drive trading in the weeks and months to come. This was reflected in Thursday’s bearish engulfing candle (Chart 1). It is too soon to say if equity bears can build on this this week. But the very fact that the candle formed at all is indicative of how nervous bulls are with all the paper profit at hand.
Thanks for reading!
