
Following futures positions of non-commercials are as of March 31, 2020.
10-year note: Currently net short 53k, down 159k.
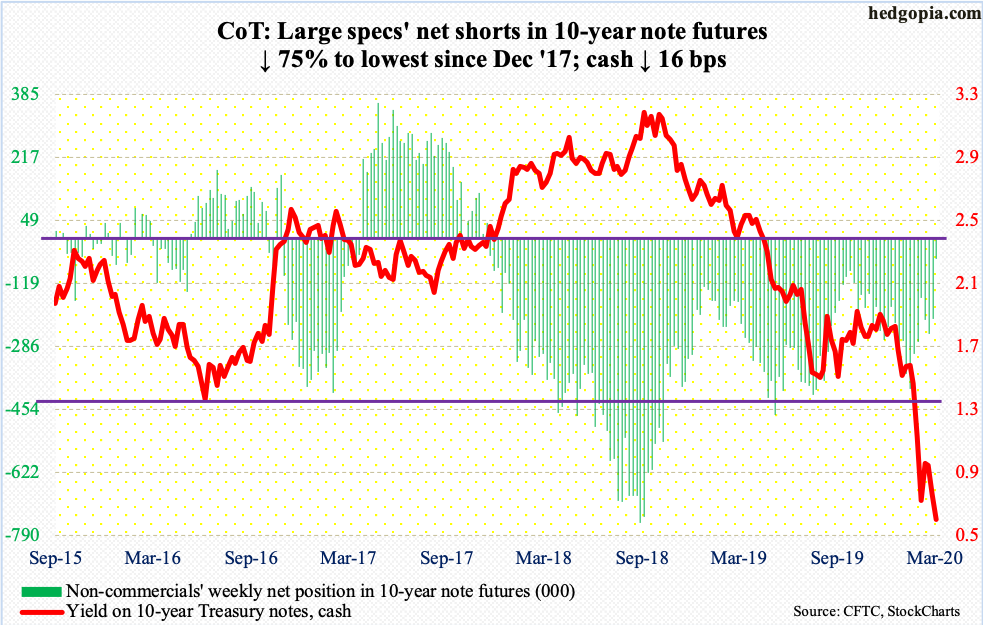
In the week to Wednesday, SOMA (System Open Market Account) holdings went up another $432.2 billion to $4.77 trillion – a new record. These holdings were up $916.9 billion in the past four weeks. The Fed had been expanding its balance sheet since the end of September last year. But back then, it was buying Treasury bills in order to deal with money-market stresses. The past three weeks in particular, its focus has shifted to Treasury notes and bonds, which this week stood at $2.78 trillion, up from $2.03 trillion three weeks ago.
On March 15th, while cutting the fed funds rate by 100 basis points to zero-bound, the Fed also committed to purchase $500 billion in Treasuries and another $200 billion in mortgage-backed securities over coming months. Then on the 23rd, an open-ended quantitative easing (QE) was announced. Hence the latest buildup in SOMA holdings.
The Fed has been aggressively buying the long end of the curve and has succeeded in pushing rates lower. On March 20th, the 10-year Treasury yield (0.59 percent) closed at 0.94 percent. Intraday, rates went as low as 0.40 percent on the 30th. There is no limit to how much the Fed can buy – at least in theory. Just to prove its point and to show financial markets that it is in control, it probably would like the 10-year to take out the all-time low of 0.40 percent from March 9th. Non-commercials are getting out of the way. They massively reduced their net shorts this week. This also means lesser fuel for short squeeze.
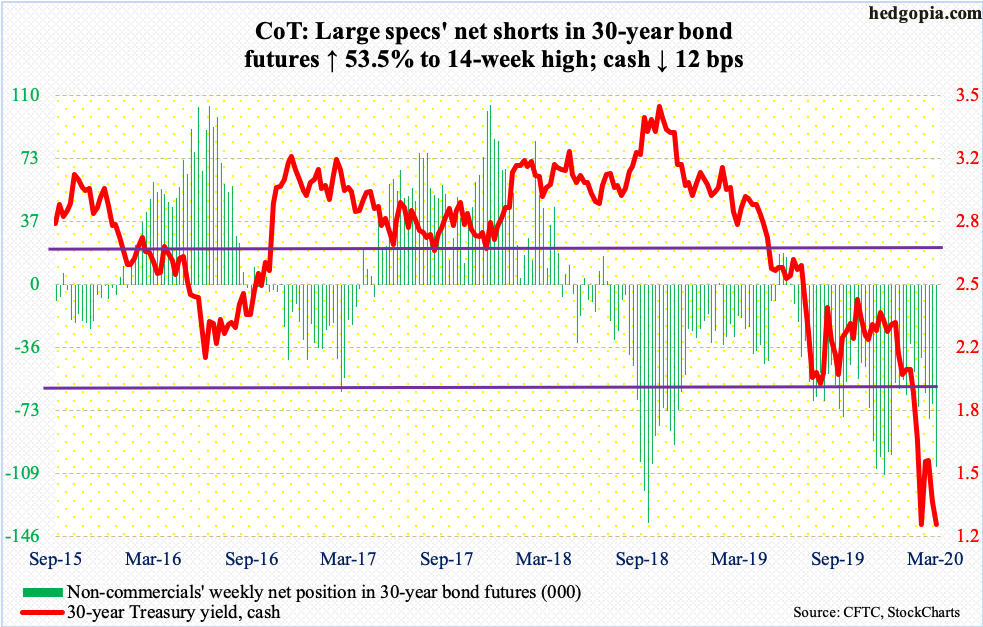
30-year bond: Currently net short 105.7k, up 36.8k.
Major economic releases next week are as follows. Markets are closed Friday for observance of Good Friday.
JOLTS job openings (February) are due out Tuesday. In January, openings jumped 411,000 month-over-month to 6.96 million. They peaked at 7.51 million in November 2018.
Thursday brings the producer price index (March) and the University of Michigan’s consumer sentiment index (April, preliminary).
PPI and core PPI in February dropped 0.6 percent and 0.1 percent m/m. In the 12 months through February, they respectively advanced 1.3 percent and 1.4 percent.
Consumer sentiment in March tumbled 11.9 points m/m to 89.1. This is still a very healthy number, and faces downward risk in the months ahead. Going all the way back to November 2016, there have only been one other sub-90 print, which was last August with a reading of 89.8.
The consumer price index (March) is scheduled for Friday. February CPI and core CPI respectively increased 0.1 percent and 2.3 percent m/m. They respectively rose 0.2 percent and 2.4 percent year-over-year.
WTI crude oil: Currently net long 606.8k, up 3.3k.
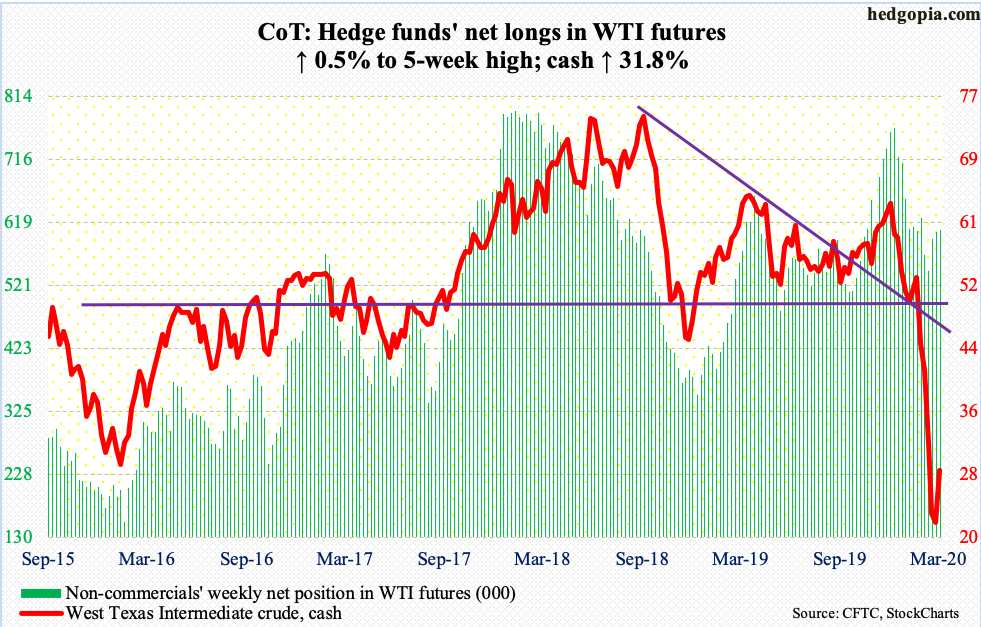
Monday, the cash ($28.34/barrel) fell to a new intraday low of $19.27 but this was still within the sideways pattern the crude had been in the prior several sessions. Thursday, it shot up 24.7 percent. This was followed by another 11.9-percent jump Friday. Saudi Arabia called for an urgent Monday meeting between OPEC members and its allies, collectively known as OPEC+. The aim is to strike a balance between demand and supply, with the former down and the latter up. The U.S., which is now the leading producer of crude, may be asked to chip in as well – or, for that matter, other producers such as Canada, Norway or Brazil.
In the week to March 27, U.S. crude production remained unchanged at 13 million barrels/day, just slightly off record 13.1 mb/d which was hit in both February and March. Production is holding up but refinery utilization is under pressure, with the latter having dropped five percentage points to 82.3 percent. Stocks of crude and gasoline jumped 13.8 million barrels and 7.5 million barrels to 469.2 million barrels and 246.8 million barrels respectively. Distillate stocks, however, dropped 2.2 million barrels to 122.2 million barrels, while crude imports dropped 70,000 b/d to six mb/d.
Even if a deal to cut output is struck, there is now a substantial amount of excess oil needing to be worked off. In more ways than one, this is reflected in the way the price collapsed. WTI fell off a cliff the past three months, having tagged $65.65 on January 8th.
Thursday’s rally stopped at $27.30s, which was taken care of Friday. There is gap-down resistance at $35.
E-mini S&P 500: Currently net short 28.8k, up 41.5k.
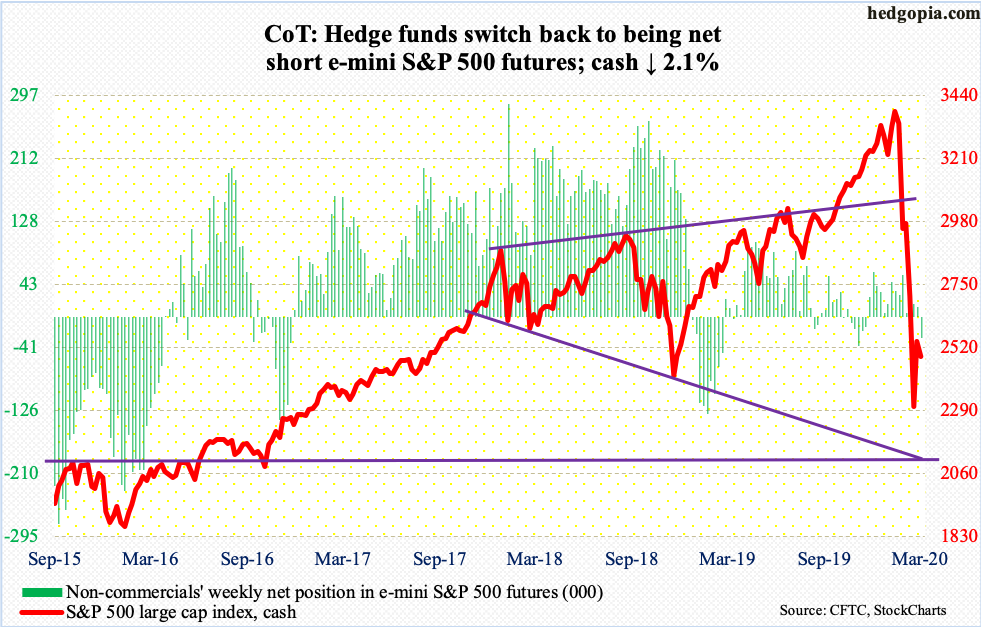
After six consecutive weekly outflows totaling $90.5 billion, U.S.-based equity funds took in $3.9 billion in the week to Wednesday (courtesy of Lipper). In the same week, SPY (SPDR S&P 500 ETF), VOO (Vanguard S&P 500 ETF) and IVV (iShares Core S&P 500 ETF) collectively lost $1.5 billion (courtesy of ETF.com). Funds continue to move into money markets, which have now grown to $4.4 trillion, up an astounding $762.8 billion in the past five weeks. This will come in handy someday for the bulls.
Both this week and last, rally attempts were rejected at 2630s. Tuesday, the cash (2488.65) rallied to 2641.39 before reversing. A 38.2-percent Fibonacci retracement of the February 19th-March 23rd decline rests at 2650.89 (more on this here). The daily is itching to go lower.
Euro: Currently net long 74.2k, up 13k.
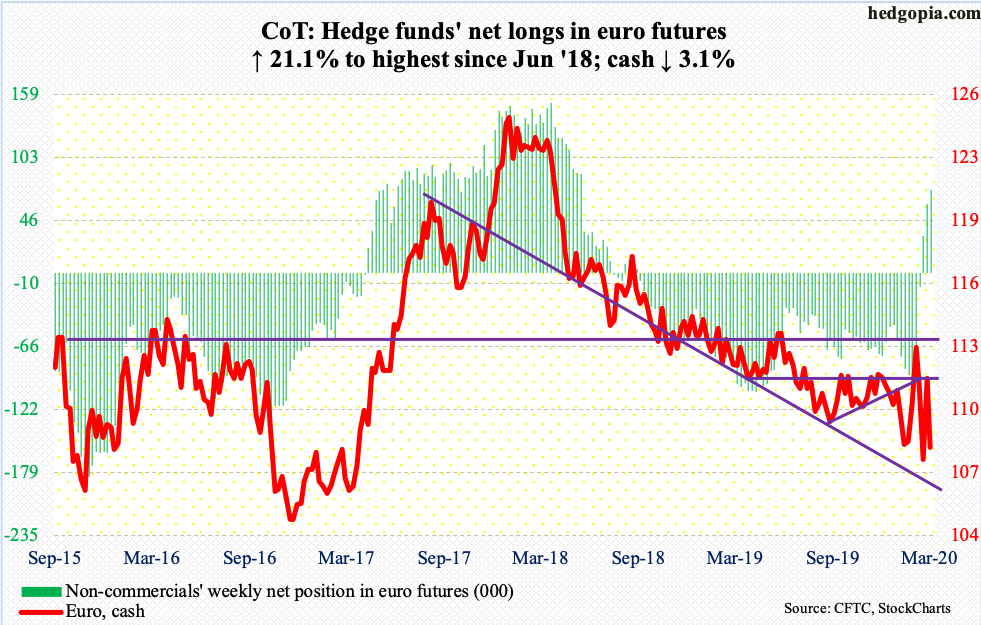
Horizontal resistance at $111.80s was not quite tested before sellers came out of the woodwork as soon as the week got underway. This, of course, preceded a six-session intraday rally from $106.35 to last Friday’s $111.55. This week, the cash ($108.11) lost 3.1 percent, piercing through both the 50- and 200-day. Immediately ahead, $107.80s is relevant, and this was kind of defended Friday, with the session low of $107.72.
Gold: Currently net long 258.8k, down 29.5k.
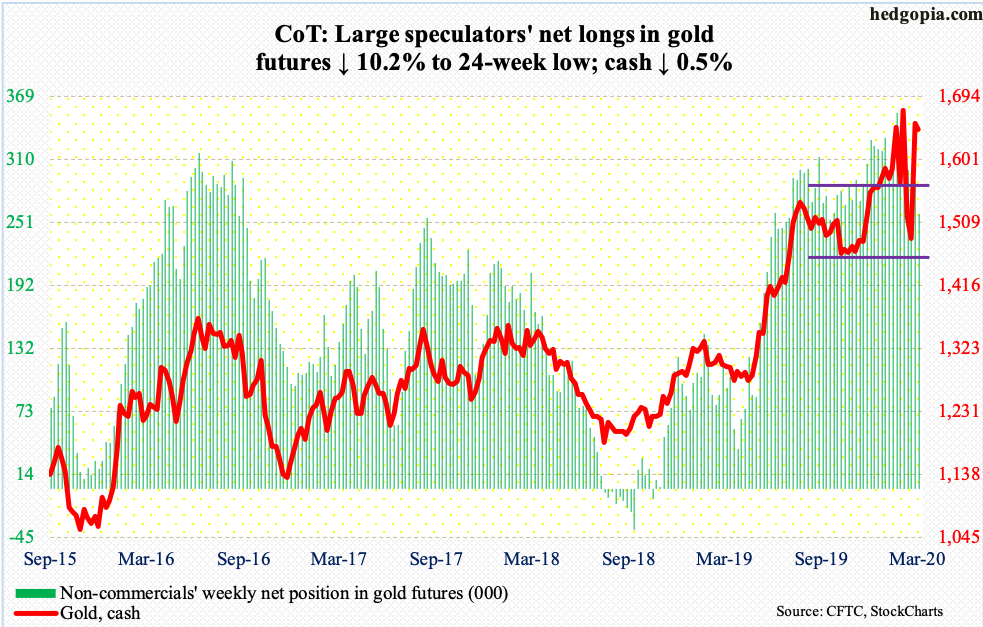
March ended up with a long-legged doji, with a range of $1,704.30 and $1,450.90. The cash ($1,645.70/ounce) has been trending higher for a while now, with the most recent low at $1,440s last November. This was defended last month. At the same time, resistance at $1,700 is proving tough. Sellers repeatedly showed up at that level last month.
Gold rallied 1.9 percent in March. This was a month in which risk assets were butchered and the Fed announced unlimited QE. Gold bugs were probably hoping the metal would perform better. Their optimism was reflected in ETF flows. In March, IAU (iShares Gold Trust) gained $717 million and GLD (SPDR Gold ETF) $1.7 billion (courtesy of ETF.com). Non-commercials similarly are heavily net long gold futures, although they have been cutting back in recent weeks.
March’s trading range suggests both bulls and bears are putting their foot down. Either way it breaks, momentum should follow. Right here and now, bulls are needing to prove themselves.
Nasdaq 100 index (mini): Currently net long 21.4k, down 6k.
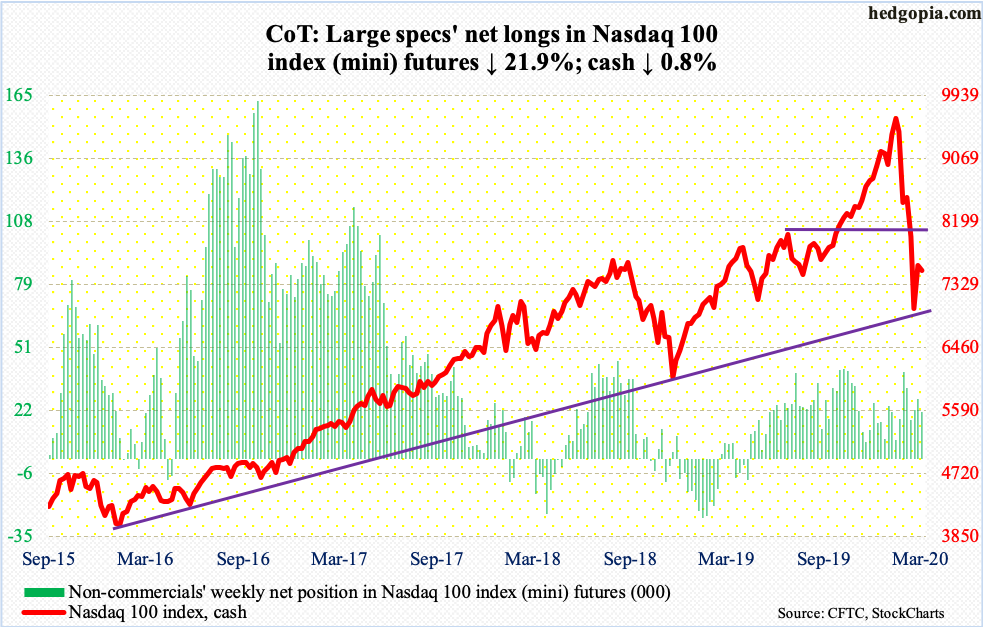
After attracting $6.5 billion in the prior couple of weeks, QQQ (Invesco QQQ Trust) lost $2.5 billion in the week to Wednesday (courtesy of ETF.com).
Tuesday, the cash (7528.11) tried to take out horizontal resistance at 8,000 but was strongly rejected. The 10- and 20-day are itching for a potentially bullish crossover, but at the same time the daily looks to be wanting to go lower.
In the event the Nasdaq 100 comes under pressure near term, as long as last week’s low (6771.91) is not breached, bulls deserve the benefit of the doubt. That low defended a rising trend line from February 2016.
Russell 2000 mini-index: Currently net short 13.2k, down 6.5k.
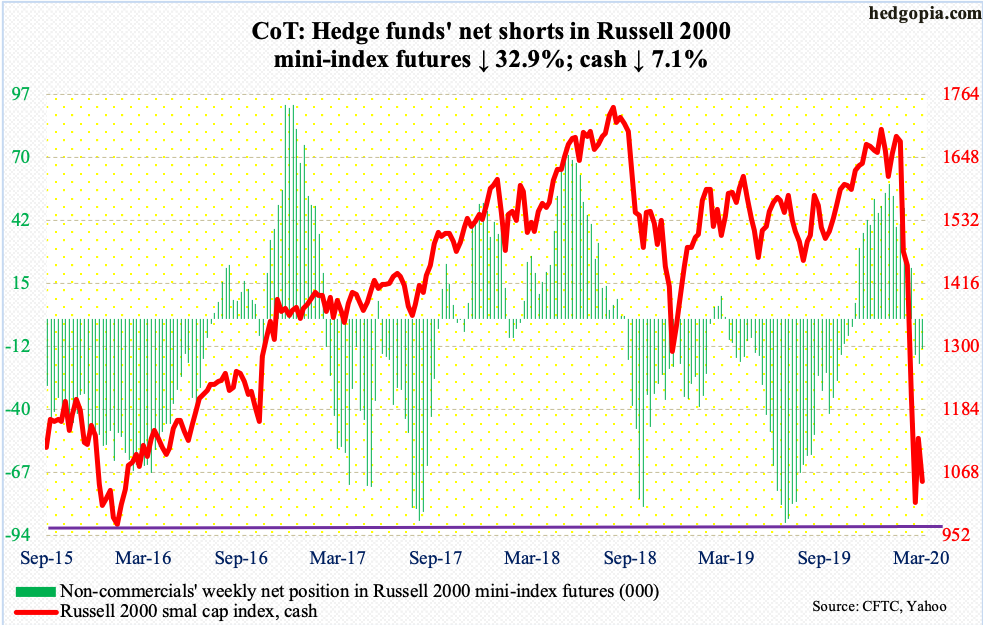
If small-caps are used as a barometer, despite the big rally in stocks off the recent lows, investors are yet to adopt a risk-on attitude. Bulls were unable to break through 1160s on the cash (1052.05). For the week, the Russell 2000 collapsed 7.1 percent, much worse than its U.S. peers.
In the second half last month, bids showed up several times at 960s. This was essentially a defense of February 2016 lows. Bears once again could be eyeing this.
In the week to Wednesday, $1.2 billion came out of IWM (iShares Russell 2000 ETF), even as IJR (iShares Core S&P Small-Cap ETF) attracted $291 million (courtesy of ETF.com).
US Dollar Index: Currently net long 14.1k, up 1.5k.
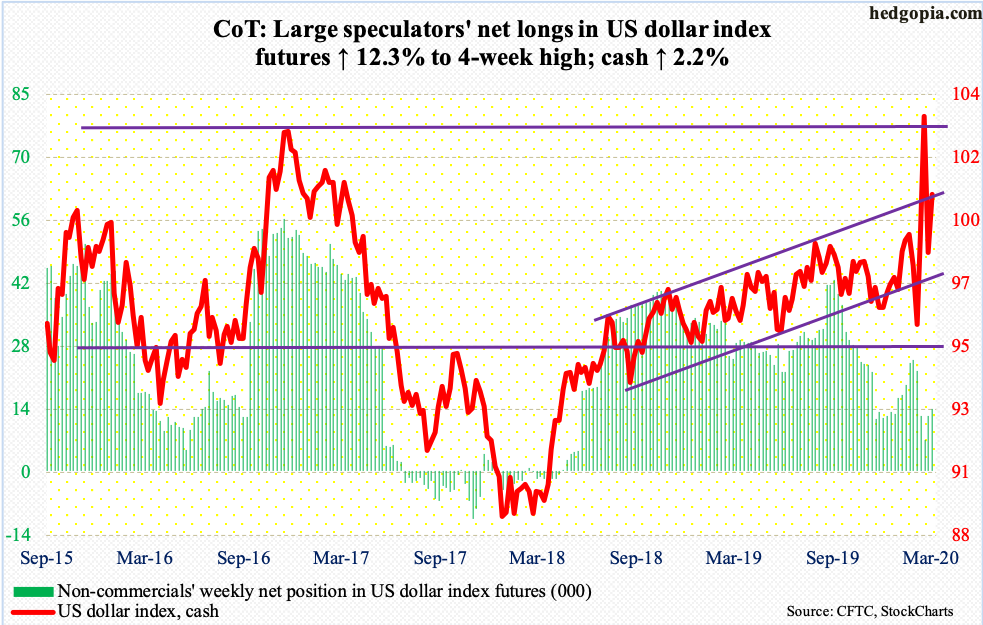
The cash (100.68) continues to be on a roller coaster.
From 94.61 on March 9th to 103.96 on the 23rd to 98.34 on the 27th to Friday’s high of 100.96, the US dollar index has been very volatile, to put it mildly. This week’s high kissed the upper end of an ascending channel from August/September 2018. This has proven to be an important roadblock. Three weeks ago, bulls staged a breakout, but bears forced it right back into the channel the very next week.
VIX: Currently net short 18.4k, down 331.
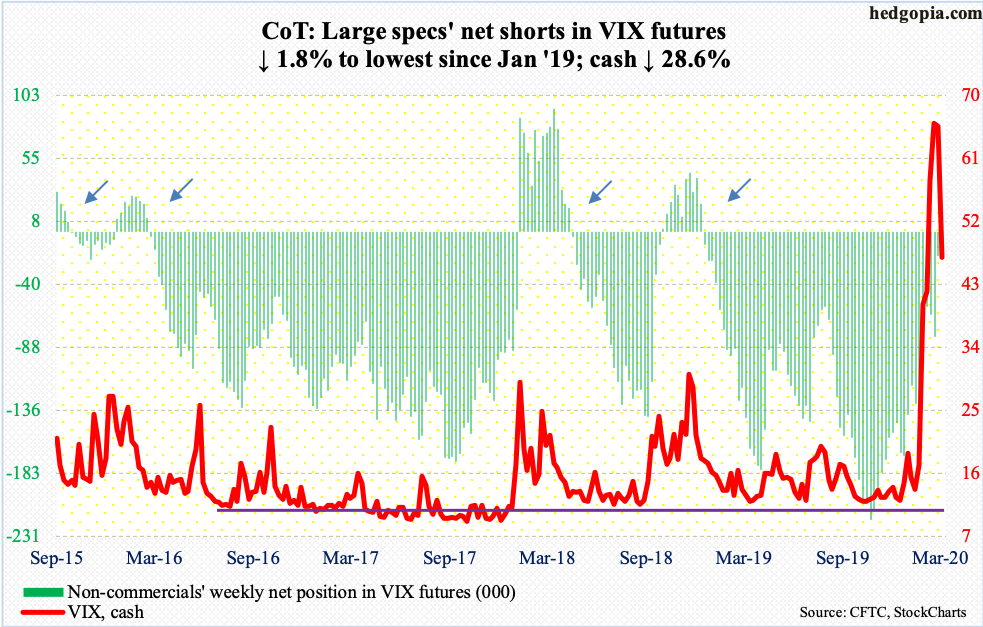
Since peaking at 85.47 on March 18th, which was the highest since the record high 89.53 from October 2008, the cash (46.80) has made lower highs.
VIX is losing altitude – gradually. This week, it lost 28.6 percent, even as the S&P 500 was down 2.1 percent. Last week, it dropped to 36.24 intraday to successfully test the December 2018 high when the volatility index peaked at 36.20. This remains an important reference point to watch near term. The 50-day at 37.95 lies around there as well.
Thanks for reading!
