
Following futures positions of non-commercials are as of April 2, 2024.
10-year note: Currently net short 570k, down 8.4k.
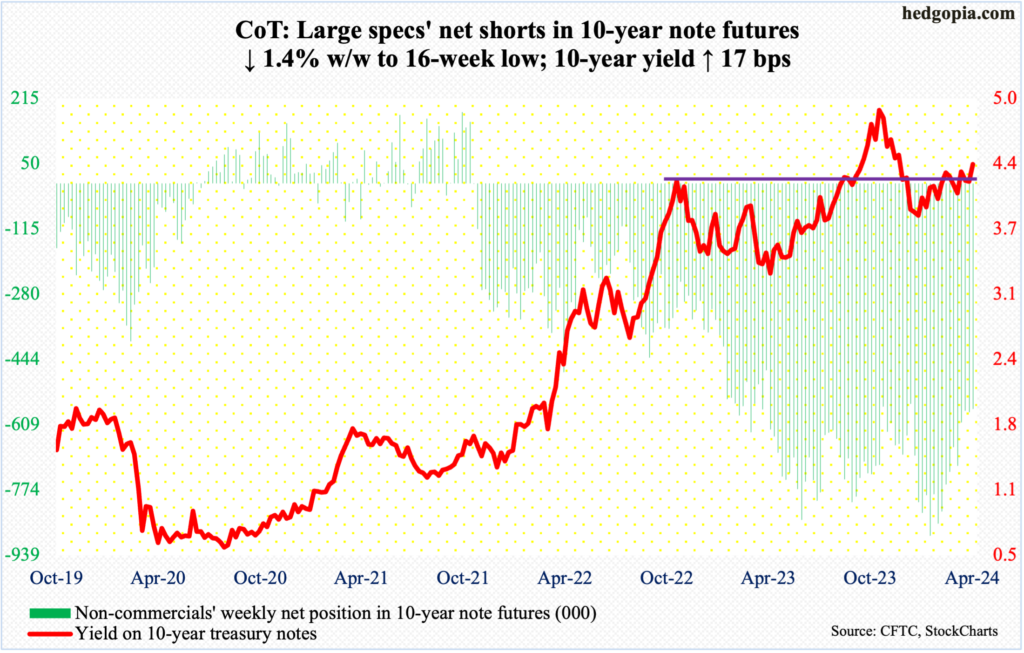
Minutes for the March 19-20 FOMC meeting are due out Wednesday. At this point, no one probably cares what the members discussed in a meeting that took place three weeks ago. A lot has happened since then.
Economic data continue to roll in stronger than expected, with March producing a blockbuster 303,000 non-farm jobs. Add to this the $4.1 trillion in market cap the S&P 500 added in the December quarter and another $4 trillion in the March quarter, greatly helping loosen the financial conditions. Hence the question if three 25-basis-point cuts – as forecasted by the December FOMC dot plot and reiterated in March – are justified at all this year.
FOMC members themselves are beginning to toy with this question. Neel Kashkari, Minneapolis Fed president, this week saw possibility of no rate cuts this year. His counterpart in Atlanta, Raphael Bostic, two weeks ago said he only expects one cut this year. Jerome Powell, on the other hand, continues to lean dovish. If data cooperated, the “data dependent” Federal Reserve chair would have already cut. But data refuses to cooperate.
Amidst all this, fed funds futures traders continue to expect three cuts this year. Until not too long ago, they were expecting six to seven cuts this year and were forced to adjust their expectations down. The way things have evolved on the economic front, more downward adjustments are probable.
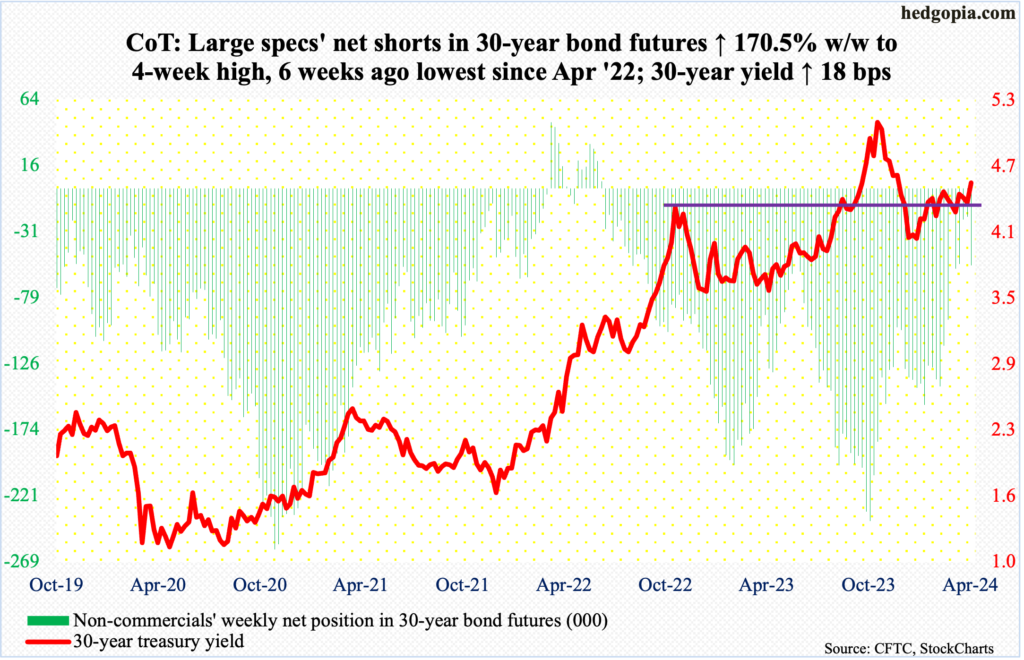
30-year bond: Currently net short 55.7k, up 35.1k.
Major US economic releases for next week are as follows.
The NFIB optimism index (March) is scheduled for Tuesday. Small-business job openings dropped two points month-over-month in February to 37 – a 37-month low. The sub-index hit a record high 51 in September 2021 and May 2022.
Wednesday brings the consumer price index (March). In the 12 months to February, headline and core CPI increased 3.15 percent and 3.75 percent. They peaked in 2022 at 9.06 percent (June) and 6.63 percent (September) respectively.
The producer price index (March) is due out Thursday. From a year ago, headline and core wholesale prices rose 1.6 percent and 2.8 percent in February, in that order.
The University of Michigan’s consumer sentiment index (April, preliminary) will be reported Friday. In March, sentiment firmed up 2.5 points m/m to 79.4, which was the highest since July 2021. In June 2022, sentiment hit a record low 50.
WTI crude oil: Currently net long 327.9k, up 5.4k.
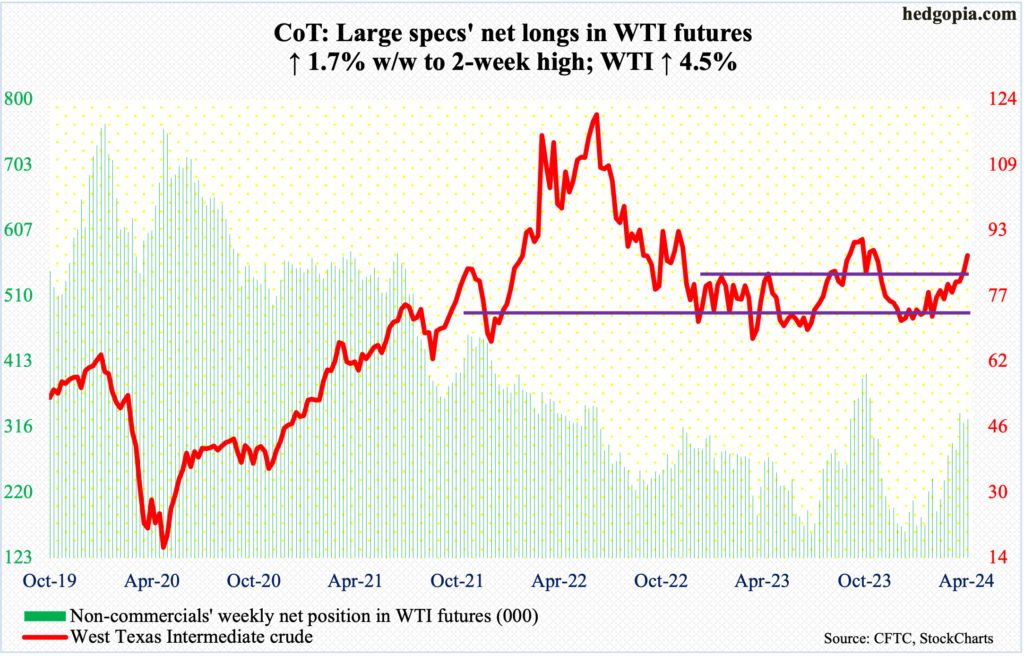
After jumping 3.2 percent last week, West Texas Intermediate crude added another 4.5 percent this week to $86.91/barrel. This week’s gains followed last week’s decisive range breakout. The crude went back and forth between $71-$72 and $81-$82 for a year and a half before pushing through the upper end last week.
WTI has come a long way since bottoming at $67.71 last December. Conditions are overbought, but oil bulls have wrested control of momentum for now. As things stand, in the best of circumstances, they have a shot at low-$90s.
In the meantime, as per the EIA, US crude production in the week to March 29th was unchanged for four consecutive weeks at 13.1 million barrels per day; six weeks ago, output was at a record 13.3 mb/d. Crude imports decreased 84,000 b/d to 6.6 mb/d. As did stocks of gasoline and distillates, which respectively declined 4.3 million barrels and 1.3 million barrels to 227.8 million barrels and 116.1 million barrels. Crude inventory, however, grew 3.2 million barrels to 451.4 million barrels. Refinery utilization dropped one-tenth of a percentage point to 88.6 percent.
E-mini S&P 500: Currently net short 78.1k, down 91.3k.
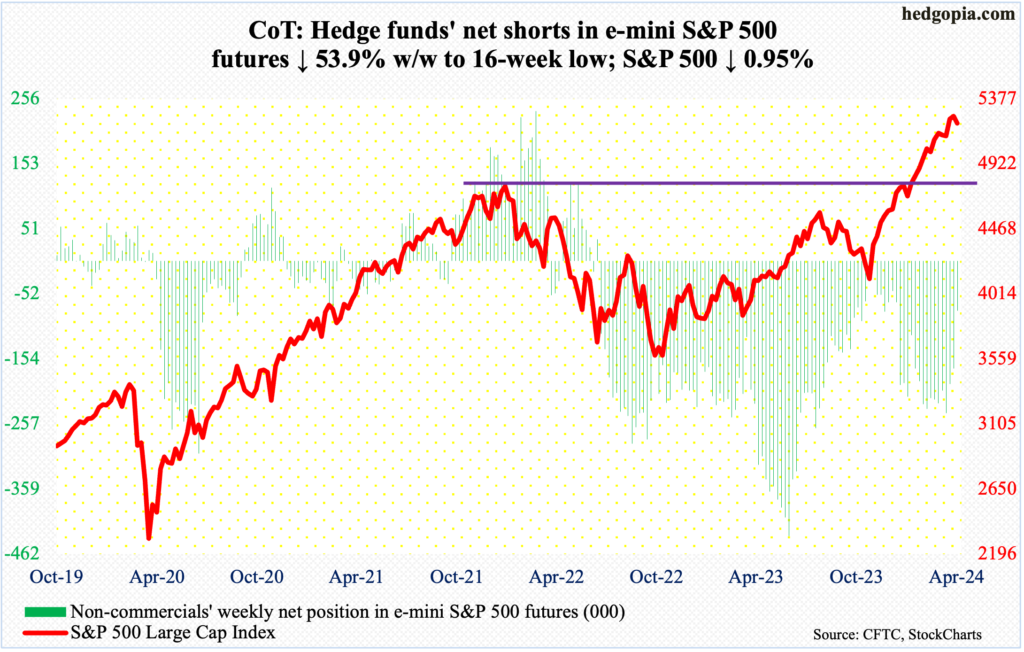
Non-commercials are actively reducing their net shorts, with holdings at a 16-week low; in the week to March 12th, they were net short 239,827 contracts, which have now been cut down to 78,122.
On March 12th, the S&P 500 closed at 5175 and went on to post a fresh intraday high of 5265 on the 28th, with the following session (April 1st), which was a Monday, ticking 5264 before weakening slightly. Non-commercials probably thought the large cap index is setting up for another breakout at 5260s. It will be interesting to find out how they reacted to Thursday’s intraday reversal to the downside (more on this here); at the session low, the cash was down 2.1 percent for the week. In the end, thanks to Friday’s 1.1-percent rally, the weekly loss was reduced to one percent.
Since last October’s low, bulls have been in absolute control and are not going to give up the momentum they have gained without a fight. They put their foot down on Friday. But they are now also dealing with a breach of trendline support from last October, not to mention an RSI divergence. Friday’s rally enabled them to reclaim 5170s, but for them to regain momentum, they will need to break out of 5260s as soon as possible.
Euro: Currently net long 16.8k, down 14.4k.
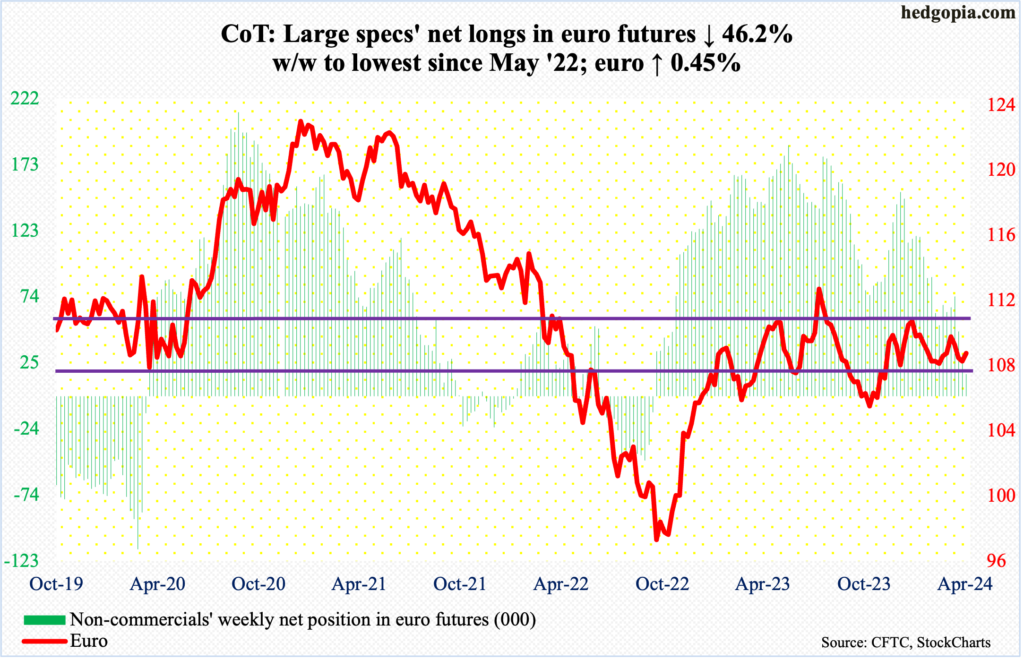
Bids showed up before the February 13th low of $1.0701 was genuinely tested, with the euro beginning the week with Monday’s intraday drop to $1.0731 and generating longs’ interest. By Friday, the currency gained 0.5 percent for the week to $1.0837 – just above the 50- and 200-day moving averages at $1.0828 and $1.0834.
The weekly gain came after three consecutive down weeks. The euro trended lower after ticking $1.0981 on March 8th. There is horizontal resistance at $1.10.
Gold: Currently net long 207.3k, up 8k.

Gold bottomed at $1,824 last October. Friday, it ticked $2,350 intraday with a close of $2,345/oz – both new highs.
The rally shifted into a higher gear after the metal broke out of $2,080s, which was touched the first time in August 2020, early last month. At some point, breakout retest will occur. But the way the rally has unfolded, there is support before that happens, with the nearest at $2,240s.
Amidst this, non-commercials, who have been adding to net longs the last several weeks, could be tempted to show some aggression. If this scenario pans out, gold bears will be forced to wait before the overbought condition the metal is in gets unwound. The daily RSI closed this week at 82.7 and the weekly at 76.5.
Nasdaq (mini): Currently net short 5.2k, down 1.9k.
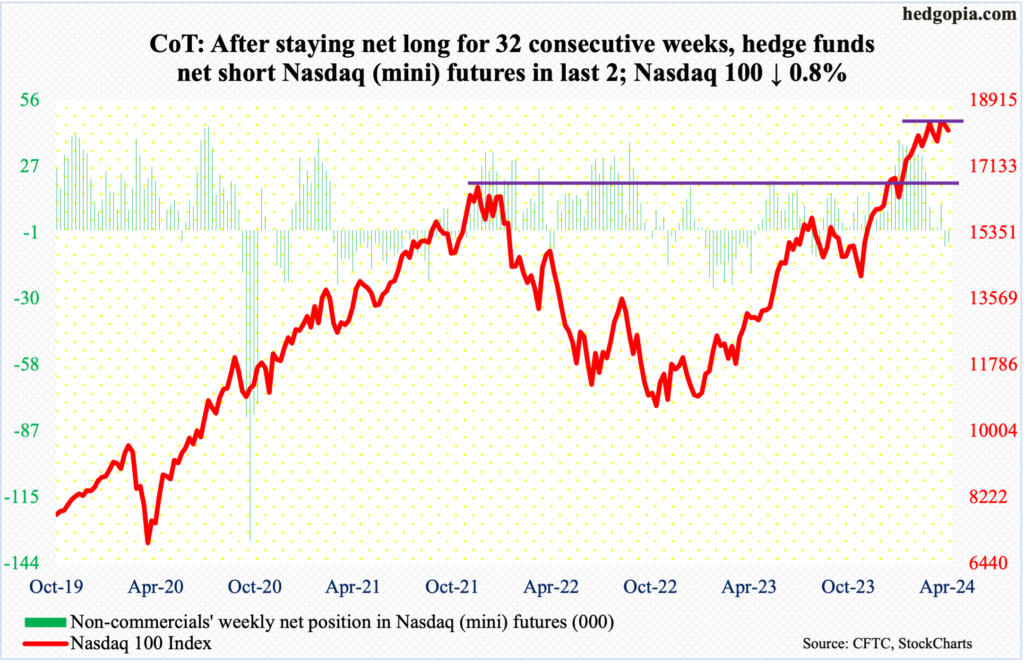
Thursday’s drop closed the Nasdaq 100 just under the 50-day (17915). The average has not been breached since last October when the index bottomed. Tech bulls needed to show some determination and they did do that on Friday when the intraday low tagged the average and the index rallied 1.3 percent for the session.
For the week, the index fell 0.8 percent, which was better than a loss of 2.1 percent at Thursday’s low, which is small consolation for the bulls. Their problem lies in a sideways action that has now gone on for five weeks. On March 1st, the Nasdaq 100 tagged 18333; this week’s high of 18392 was posted on Monday. The all-time high of 18465 was recorded on March 21st.
Beside the loss of momentum – with RSI divergence – the tech-heavy index (18108) is in breach a rising trend line from last October’s low three weeks ago (more on this here).
Russell 2000 mini-index: Currently net short 22.2k, up 626.
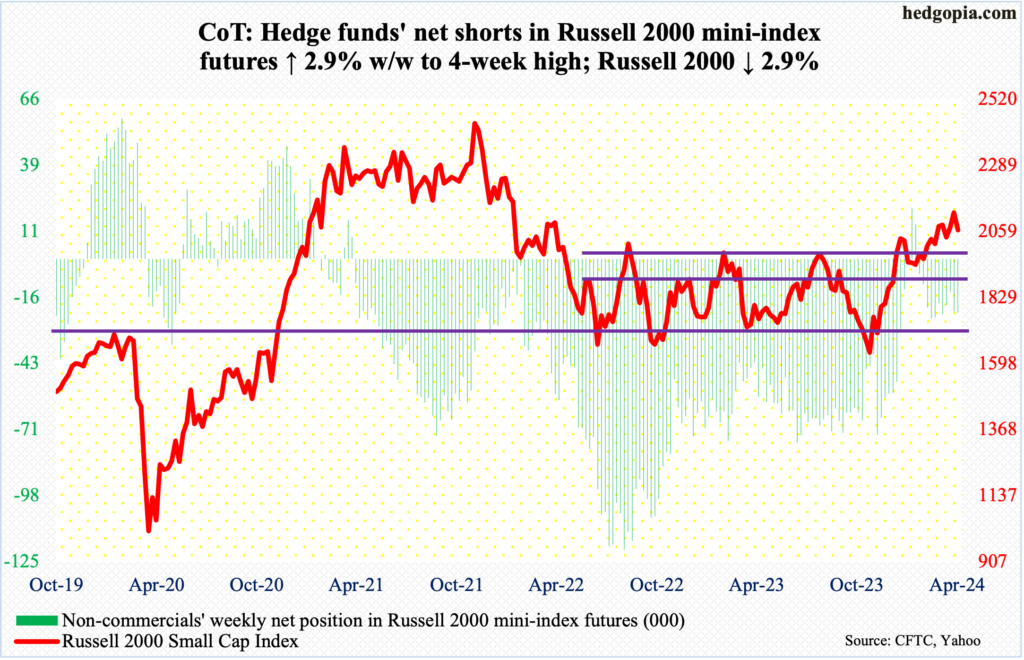
One more week and one more rejection at 2100, which has stopped small-cap bulls for the past month. The March 28th intraday high of 2135 set a two-year high, but the Russell 2000 continues to struggle staying above 2100. This week, it rallied north of the resistance twice intraday but only to close the week down 2.9 percent to 2063.
Horizontal resistance at 2100 goes back to January 2021. This level also represents a measured-move target of a 1700-1900 range breakout on December 13th. Continued rejection at 2100 raises the odds the index heads toward at least 2000 in due course.
US Dollar Index: Currently net short 1.9k, up 1.3k.
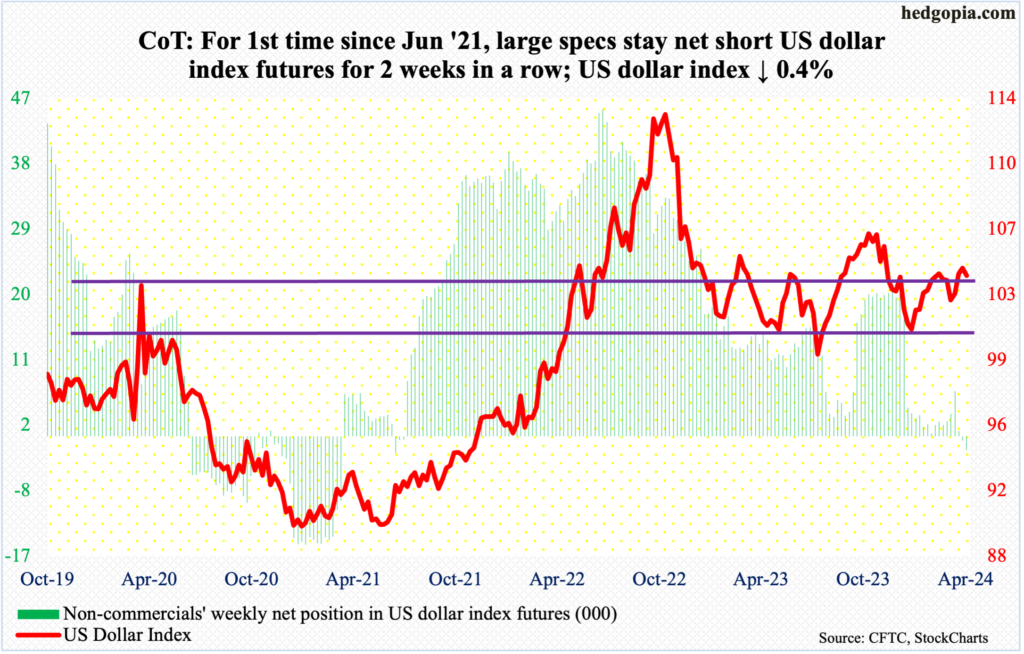
The US Dollar Index dropped 0.4 percent this week to 104.07. This came in a week in which the long end of the treasury yield curve rallied nicely. After three straight up weeks, it is possible fatigue is setting in.
Resistance at 103-104 goes back to December 2016. Tuesday’s intraday high of 104.84 just about tested the February 14th high of 104.88. Back then, after that high, the index came under pressure to eventually bottom at 102.30 on March 8th.
Odds favor the dollar index weakens in the sessions ahead.
VIX: Currently net short 50.3k, up 6.4k.
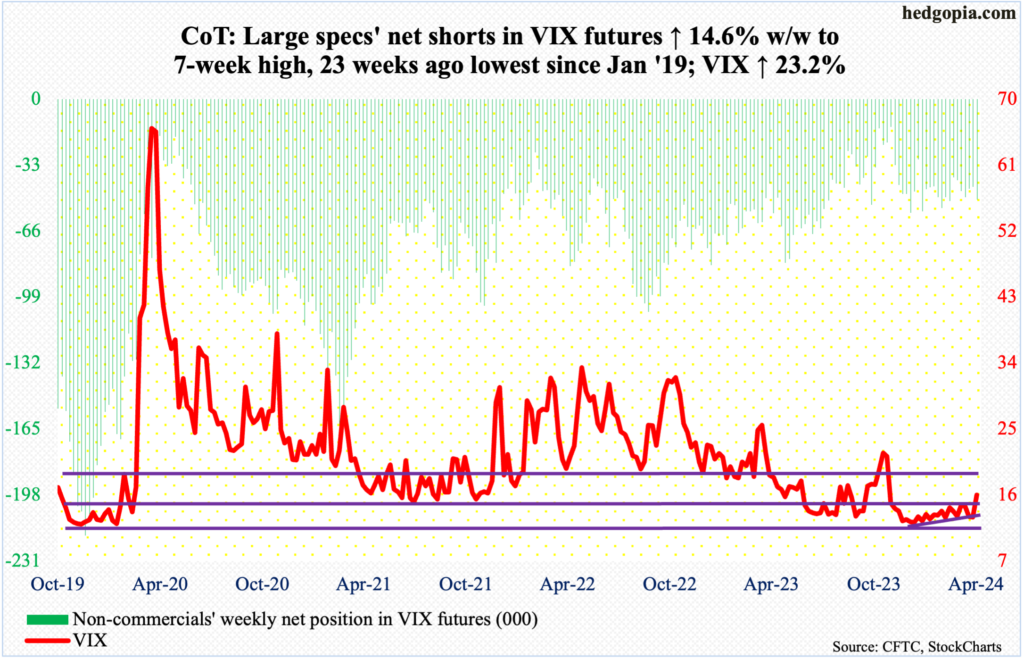
The breach two weeks ago of a rising trend line from December 12th when VIX bottomed at 11.81 is proving false. This week, the volatility index jumped 3.02 points to 16.03, with Thursday rallying as high as 16.92.
VIX remains above both the 50- and 200-day (respectively at 13.95 and 14.66), with both averages slightly rising. This is also the first time since last October the weekly RSI (at 56.22) decidedly rallied past the median.
If the weekly prevails, VIX has more room to rally. The caveat in this is that the daily is now getting extended.
Thanks for reading!
