
June’s housing starts will be published this Friday. Month-to-month, this is a volatile series. May was down 11 percent, while April was up 22 percent. Historically, starts remain low. As Chart 1 shows, it is not often the green line remains under one million units in non-recessionary times.
With that said, recent trends are going the right direction. In eight of the last 12 months, starts have come in north of a million. The 12-month rolling total has exceeded one million the last six months.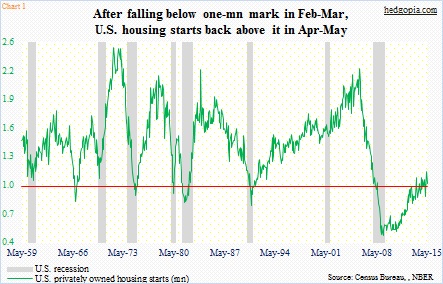
How would ITB, the iShares Home Construction ETF, react if the momentum continues? Of late, it has struggled to positively react to good housing numbers. This can change – particularly considering stocks in general seem to be itching to move up near-term.
The ETF finds itself at an interesting juncture. While the possibility that it is in the process of forming the right half of a head-and-shoulders pattern is still there, it also sits right underneath the upper end of a two-and-a-half-month rising channel (Chart 2). A break above that resistance has the potential to draw in buyers and/or cause shorts to cover – at least in the near-term.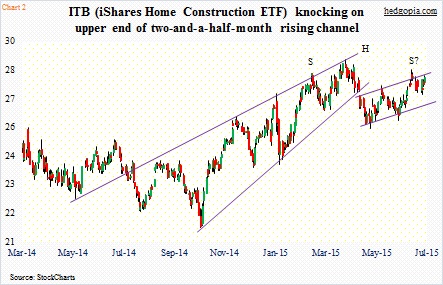
Speaking of shorts, short interest on ITB dropped 12 percent in the June 30 period, to 13.2 million. The ETF rallied two percent in the June 15-30 period; in fact, at one point it was up five-plus percent. Shorts got squeezed. This year, there have been two other occasions in which shorts met the same fate. Short interest fell from 15 million at end-January to 11.4 million two months later; the ETF rallied from $25.30 to $28.21. Then it dropped from 15.2 million at end-April to 13 million at the end of May; ITB rose from $25.90 to $27.62 before dropping.
In the event of a breakout, it is possible there is a rush to cover, even though shorts’ ranks are thinner than in the middle of June.
What are they to do then?
The hypothetical ITB 27.50 naked call written on July 2 is now slightly in the money with an effective short price of $28.16, thanks to last week’s short put earning $0.28. The ETF closed at $27.98 Friday.
One way to deal with the trade is to simply do a short collar.
July 17th at-the-money 28 puts and calls are each selling at $0.30. A short collar can be deployed with no cost (short put and long call in combination with the existing short). If the ETF rallies this week, the long call will participate. If it stays under $28, the short position gets covered for a profit of $0.16.
Then we have Greece. Shortly before midnight, U.S. index futures were down. It should not come as a surprise if that weakness gets bought today. But then again it may not. Who knows? Headline risks are high right now. With that in mind, it is probably safe to just stay out of the way for now – cover for a profit of $0.18.
Thanks for reading!
