
The top five weights in QQQ, the Nasdaq 100 ETF, are: Apple (AAPL), 11.4 percent; Alphabet (GOOGL, formerly Google), 9.2 percent (both A and C); Microsoft (MSFT), 8.5 percent; Amazon (AMZN), 5.8 percent; and Facebook (FB), 4.5 percent.
The tech-heavy index is market-cap-weighted, so obviously large-caps have larger impact.
In 2015, the ETF rallied 9.4 percent… thanks to handsome contribution from the leading names. Except for AAPL, which was down three percent, AMZN surged 117.8 percent, GOOGL 46.6 percent, FB 34.2 percent, and MSFT 22.7 percent. Netflix (NFLX), which only makes up 0.9 percent of the ETF, surged 134.4 percent.
After the heady performance last year, they have entered the new year with hangover.
QQQ was down 6.9 percent in January. And of the five names above, FB was the only one with a positive month, up 7.2 percent. AMZN was down 13.2 percent, AAPL down 7.5 percent, GOOGL down 2.1 percent, and MSFT down 0.7 percent.
So far, February has brought more red, with the ETF down 1.9 percent. Individually, AAPL is down 2.9 percent, AMZN down six percent, and MSFT down 3.8 percent. GOOGL and FB are up 2.6 percent and 2.1 percent, respectively.
They have all reported their December quarter. Post-earnings, AAPL and AMZN shares reacted poorly, and FB, GOOGL, and MSFT positively.
Of the ones with positive reaction, action in FB and GOOGL are worth a look.
On Thursday last week, FB ($114.61) broke out of a three-month horizontal resistance at $108, but yesterday produced a long-legged doji right outside the upper Bollinger Band, with daily conditions now grossly overbought. A breakout retest looks imminent near-term.
Also on Tuesday, in a high-volume, post-earnings session, GOOGL produced a shooting star, preceded by a doji on Monday. It is in need of unwinding tons of daily overbought conditions.
Despite positive post-earnings reaction, both FB and GOOGL look exhausted – at least near-term. Incidentally, on a monthly chart the latter showed signs of distribution as early as November last year and is doing so again so far this month.
On a broader level, QQQ had red candles in December and January, and so far this month. This followed a monthly doji in November. Similarly, AMZN, which more than doubled last year, had a monthly doji in December, followed by a down January and a down February. Now a laggard, AAPL struggled in the $130 area from February to July last year, before giving way in August.
The point is, there are signs of exhaustion all around.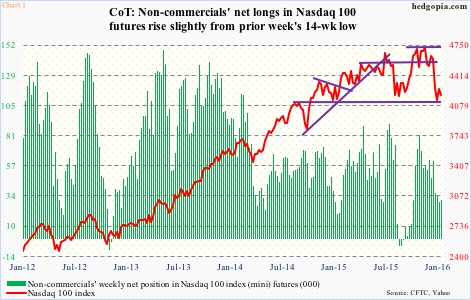
This probably explains why, despite the shellacking the Nasdaq 100 suffered the past three months, non-commercials are yet to aggressively warm up to Nasdaq 100 futures. As of Tuesday last week, they held 30,291 contracts, only up marginally from the prior week’s 29,078, which was a 14-week low (Chart 1). Between the periods, the Nasdaq 100 rallied 2.1 percent, but that was not enough to tempt these traders into adding to net longs.
Maybe they were waiting to see if QQQ ($102.15) would be able to take out resistance at $105. This has been an important price point going back to November 2014. On Monday, the ETF just about kissed that resistance, and was repelled (Chart 2). Come Tuesday, it dropped 2.2 percent, and is sitting a touch under its 10-day moving average.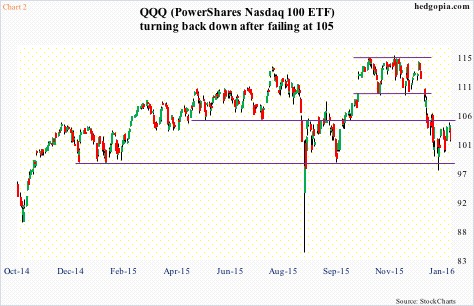
Odds favor QQQ continues to come under pressure near-term. Daily momentum indicators are in process of turning lower – similar to SPY, the SPDR S&P 500 ETF. A retest of the January 20th low looks imminent on QQQ – definitely not the right time to continue to stay long.
To refresh, on Jan 13th, January 22nd 104.50 puts were hypothetically sold for $1.35, resulting in an effective long at $103.15. The trade was $1.65 in the money until Monday, but is now $1 in the red. Cutting losses.
Thanks for reading!
