
Since late December, US stocks have rallied massively. Yet, investor sentiment has not caught up. Reason for bulls to worry or rejoice? The answer may lie in who decisively wins the bull-bear tug of war around 2800 on S&P 500.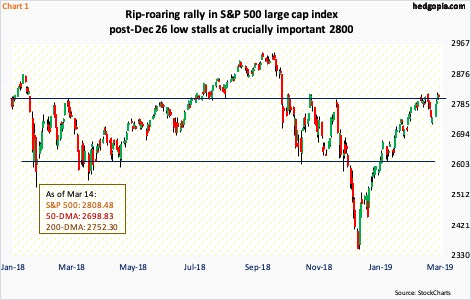
US stocks have had quite a comeback.
Intraday between early October and late December last year, the S&P 500 large cap index (2808.48) lost just a tad north of 20 percent. As bears were taking a victory lap, the index bottomed on Boxing Day. Since that low through Wednesday’s high, it rallied just north of 20 percent.
In the process, not only did the S&P 500 recapture the 50- and 200-day moving averages but also support-turned-resistance at 2600-plus. It is currently testing another crucial level at just north of 2800, which since October last year denied rally attempts several times (Chart 1). A decisive break can potentially cause shorts to turn tail. At least some. Bulls hope so. They also hope this sets in motion improvement in investor sentiment and that money on the sidelines begins to reenter.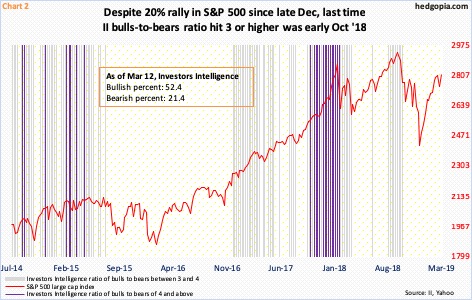
There is dry powder. Tons of it.
As of Wednesday this week, $3.1 trillion sits in US money-market funds. Since the aforementioned low in the S&P 500, these assets have gone up by nearly $73 billion, and by $241 billion since the week ended October 3 last year (courtesy of ICI). Stocks peaked early October.
Along the same lines, since late December through Wednesday this week, US-based equity funds lost $21 billion (courtesy of Lipper). Longs have used the rally to lighten up/exit. Since early October last year, nearly $129 billion has been withdrawn.
Investor sentiment is the same way.
Chart 2 reflects sentiment on behalf of newsletter writers. In the latest week, Investors Intelligence bulls fell five-tenths of a percentage point to 52.4 percent, even as bears rose eight-tenths of a percentage point to 21.4 percent. The last time the bulls-to-bears ratio printed three or higher was the week ended October 9 last year. One week before that, bulls were 61.8 percent and bears 18.6 percent. The last time the ratio hit four or higher was late January last year.
In other words, despite the rally in stocks since late December, bulls are not snorting just yet.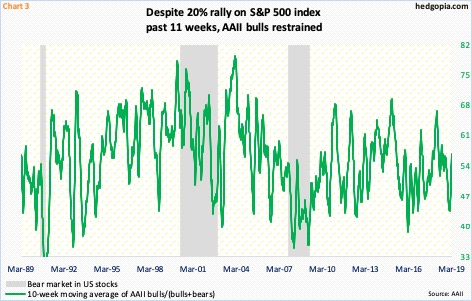
This phenomenon is also evident among individual investors. Similar to Investors Intelligence, weekly data put out by the American Association of Individual Investors is survey-based. Last week, bulls contracted by five percentage points to 32.4 percent, even as bears expanded by 4.4 percentage points. Early October last year, when stocks peaked, bulls were 45.7 percent. Now, the sentiment is much more subdued (Chart 3).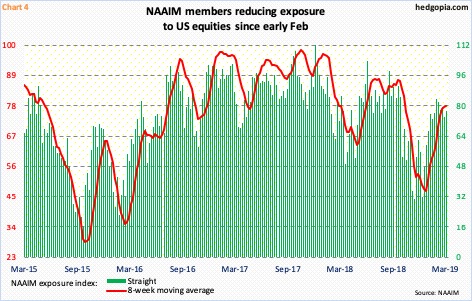
Then we have the NAIIM (National Association of Active Investment Managers) exposure index, which represents members’ average exposure to US equity markets. Here, we are talking real money, not just survey. These managers have been cutting back exposure. This week, the index rose 3.5 points to 77.4 – but still down from 83.4 in early February. Late September last year, it was as elevated as 90.7 (Chart 4).
This creates an interesting dynamic in the markets. The rather subdued reading in all these three metrics probably suggests that there is a sizable number of people who are not convinced this rally has legs. If they are right, in due course stocks begin to fall under their own weight – again – as longs begin to lock in profit. But what if bulls keep the momentum going and these non-believers eventually are forced to jump on the bandwagon? In this scenario, both investor sentiment and fund flows improve – giving rise to a mini melt-up of sort, before things fall apart.
In this respect, who wins the prevailing bull-bear tug of war around 2800 on the S&P 500 will be telling – an indication of what is to come in weeks to come.
Thanks for reading!
