
In less than a month, major U.S. stock indices have witnessed phenomenal rallies. This would be a lot healthier if risk-on metrics rallied right along.
U.S. stocks have rallied massively off of last month’s lows. From the March 23rd bottom through Tuesday’s intraday high, the S&P 500 large cap index surged 30.1 percent. That is in 16 trading sessions!
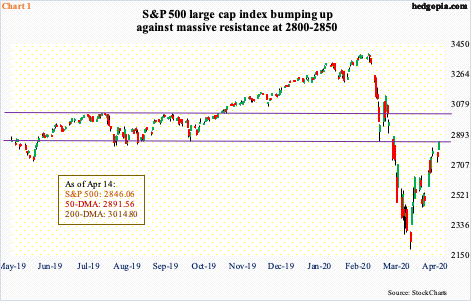
But, even after this rally, the index (2846.06) remains below 50- and 200-day moving averages, which are 1.6 percent and 5.9 percent away, in that order – shows the damage done since it peaked on February 19th.
The S&P 500 just retraced 50 percent of that decline, which lies at 2793. A 61.8-percent Fibonacci retracement of the February 19th-March 23rd collapse lies at 2934. Between 2800 and 2850 also lies horizontal resistance going back to January 2018 (Chart 1). Intraday Tuesday, the index rallied to 2851.85 before pulling back a tad. A breakout likely opens the door to a test of straight-line resistance above, which approximates the 200-day at 3014.80.
Regardless a breakout takes place or not, bulls sure wish there was improvement in adoption of risk-on metrics.
Sure, off the March 23rd low through April 9th, HYG (iShares iBoxx high yield corporate bond ETF) rallied 24.5 percent before retreating. This includes the 6.5-percent jump last Thursday when the Fed announced it would now start buying junk bond. HYG closed this Tuesday at $81.52, lower than its Thursday close of $82.36. The Fed is obviously trying to juice up this market, but investors are yet to aggressively throw caution to the wind and jump on the junk bandwagon.
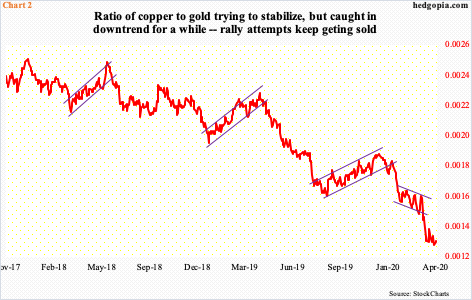
Risk-on is also not seen in the ratio of copper to gold. Copper is a major industrial metal and known as Dr. Copper for its ability to predict turning points in the global economy. Gold, on the other hand, is mostly used as a haven by risk-averse investors.
Most recently, the ratio peaked in June 2018, with rally attempts since consistently sold (Chart 2). The ratio is not signaling a turn in the economy. To be fair, copper ($2.329/pound) has rallied from its March 19th intraday low of $1.973, but so has gold which at $1,768.90/ounce closed Tuesday at the highest level since October 2012.
Historically, investors also tend to gravitate toward small-caps if they thought the economy was turning. From the March 18th intraday low of 966.22 through Tuesday’s high of 1251.88, the Russell 2000 small cap index (1237.33) rallied 29.6 percent, which is slightly less than what the S&P 500 put together.
Importantly, as the S&P 500 is brushing against resistance at 2800-2850, so is the Russell 2000, which faces five-year resistance at 1250s.
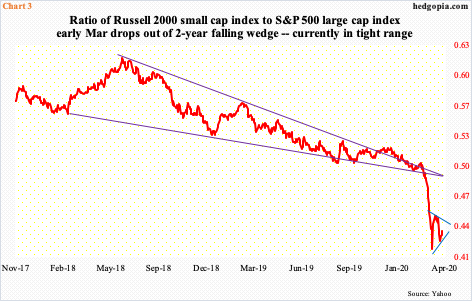
Small-caps have lagged their large-cap brethren for a while now. Early last month, a ratio between the Russell 2000 and the S&P 500 fell out of a two-year wedge. It did bottom on the 18th, with a higher low on the 3rd this month, but at the same time, it is trading in a tight range with a potential downtrend line forming above (Chart 3).
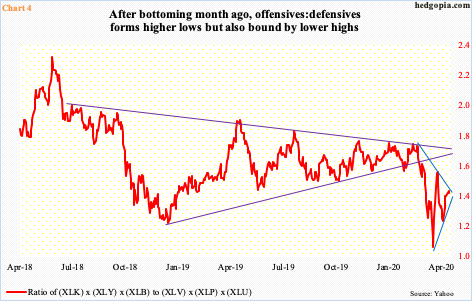
A similar price action can also be seen in Chart 4, which pits offensive sectors with defensive sectors. Six SPDR ETFs are used for this purpose. Offensives are represented by XLK (technology), XLY (consumer discretionary) and XLB (materials) and defensives by XLV (health care), XLP (consumer staples) and XLU (utilities).
Once again, late February, a ratio between the two broke down – piercing through a multi-month wedge. It bottomed on March 18th, and a rise since has found sellers at a declining trend line from February 19th, even as April 3rd saw a higher low. A decision time is upon us. Either way it breaks, momentum likely follows, with risks to the downside, as major indices, including the aforementioned S&P 500 and Russell 2000, are extended near term and are sitting at/near important resistance.
Thanks for reading!
