
U.S. corporate capital expenditures have been lackluster. That is an understatement.
As a percent of real GDP in 3Q15, non-residential fixed investment comprised 12.8 percent. The post-Great Recession high of 12.9 percent was recorded in each of the three quarters from 3Q14 through 1Q15. This is weak historically.
In the prior two cycles, the share of non-residential fixed investment peaked at 13.5 percent in 1Q08 and 14.6 percent in 3Q00.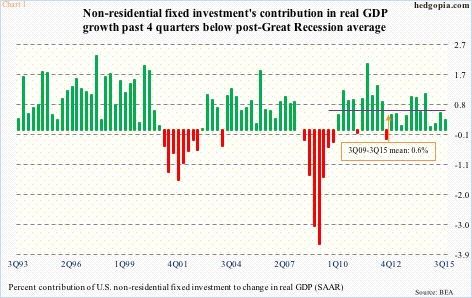
This is depicted well in Chart 1, which shows the percent contribution of non-residential fixed investment in real GDP. In 3Q15, it only contributed 0.33 percent. After Great Recession ended and the recovery began, it has averaged 0.6 percent. In the past four quarters, the bars in Chart 1 have been below that.
Yesterday, November’s revised numbers for non-defense capital goods ex-aircraft – proxy for business capX – were reported, and they continue to portray a dismal picture.
New orders were down 0.34 percent month-over-month, to $69.3 billion. Year-over-year, they have been down every month since February last year. Momentum is out the window. Orders peaked in September 2014 at $74 billion (Chart 2).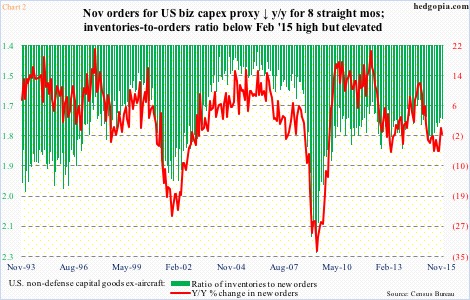
It is probable orders continue to post y/y declines until at least this month since both December 2014 and January 2015 boasted orders of north of $71 billion. It is only in February last year that orders dropped to the $67-billion range, and have stayed south of $70 billion since.
Historically, business capX and employee compensation tend to move together. Makes sense. That has also been the case in the current cycle, except there has been a breakdown in the correlation of late.
Chart 3 plots National Federation of Independent Business members’ plans for compensation and capX. Both have recovered well off Great Recession lows, although capX plans have peaked at a much lower level versus prior peaks.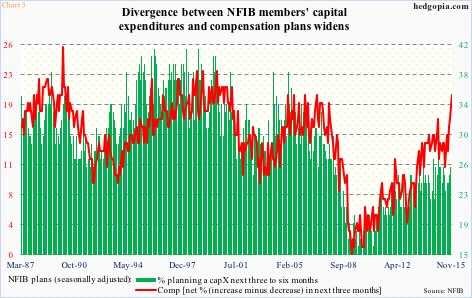
Importantly, in November the red line in Chart 3 shot up three points to 20 – matching the highs of 2004-2006. Therein lies the divergence. NFIB members’ capX plans peaked in December 2014.
U.S. corporates are not in a mood to press on the spending accelerator. As simple as that. Makes sense. The recovery is sub-par. End-demand is tepid.
Facing this, corporate boards would be understandably resistant to opening up their wallets as if the recovery was going full steam.
That said, corporations at the same time are aggressively taking on debt. Does not make sense. Fed-engineered low interest rates have created too good of a perceived opportunity to pass up.
Corporate debt issuance is all set to create a new record in 2015.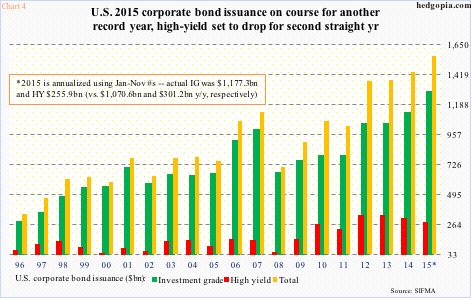
Through November, a total of $1.43 trillion has been issued, of which $1.18 trillion is investment-grade and $255.9 billion high-yield. Annualized, they amount to $1.28 trillion and $279.2 billion, respectively, for a total of $1.56 trillion (Chart 4). A new record for both investment-grade and total issuance. High-yield, however, will have dropped for two straight years; makes sense, given what crude oil/energy is going through.
The rub in all this is that not a whole lot of this debt binge is making its way into capX, as evidenced in Charts 1 and 2. Stock buybacks have benefited big time.
The irony in all this? There likely is not going to be – does not need to be – a big shift in capX anytime soon. Why? Chart 5 provides the answer.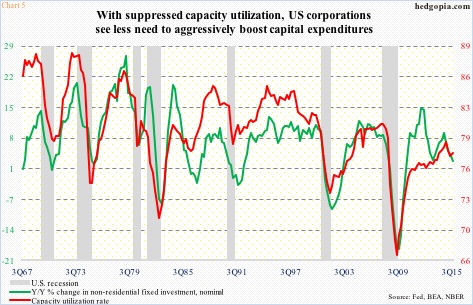
The relationship between non-residential fixed investment and capacity utilization is tight. Makes sense. Utilization peaked in November 2014 at 79.04 percent. One year later, this had dropped to 76.95 percent. Year-over-year, it has now dropped since May last year.
Incidentally, in the prior cycle, utilization peaked in April 2007 at 80.97. This time around, it did not even cross 80. Hence the lack in corporate urgency to boost CapX. In all probability, this is not likely to change anytime soon, and can have implications for a whole host of industries, not the least of which is tech.
With the recent drop, the Nasdaq 100 is six percent off its all-time highs. In what could potentially be a double-top, it began to retreat after an unsuccessful test last month of the March 2000 peak.
Thanks for reading!
