
If we just focus on tech stocks for a moment, one gets the impression that it is a very strong market.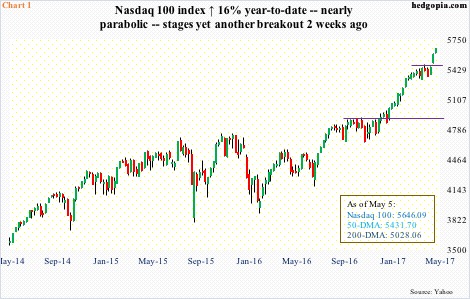
Right after the November election last year, tech stocks in general lagged. But they came into life as soon as 2017 was rung in.
Before breaking out in January, followed by successive highs, the Nasdaq 100 index went sideways around the March 2000 high of 4816.35 for five months. May-to-date, it is up 1.1 percent. If this holds, it would have logged seven consecutive months of gains.
Particularly this year, the index has rallied almost in a parabolic fashion – already up 16 percent (Chart 1).
Even within tech, large-caps are leading. The top five – Apple (AAPL), Alphabet (GOOGL), Microsoft (MSFT), Amazon (AMZN), and Facebook (FB) are all trading near all-time highs.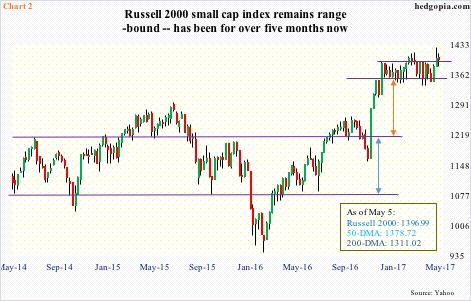
Small-caps are sending a totally different message.
Post-election, the Russell 2000 small cap index rallied 16.5 percent in a month to 1392.71 on December 9. Since then, it has been range-bound with that high on the up and 1340s on the down (Chart 2).
There was a false breakout mid-February. But the range support never gave away. There was another breakout on April 24, on to a new high of 1425.70 two sessions later. The subsequent sell-off was defended near the 50-day moving average last Thursday, closing out the week above resistance, but barely. In essence, it is still range-bound. Both March and April produced a monthly spinning top candle.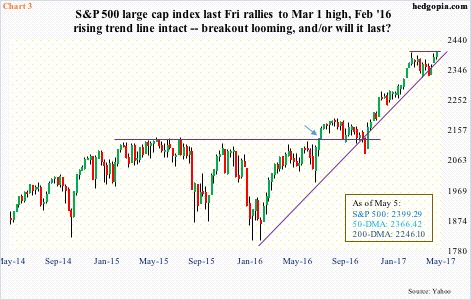
The S&P 500 large cap index lies somewhere in between. It does not act as strong as the Nasdaq 100 but not as tentative as small-caps.
The index had a major breakout around 2120 last July (arrow in Chart 3), followed by successful breakout retest in August through November. The subsequent rally took it all the way to 2400.98 on March 1 before going sideways. Last week, after defending the rising 10-day moving average on Wednesday through Friday, it closed right at the prior high.
The mixed messages telegraphed by these three indices are also evident in how moving averages are behaving.
On the Russell 2000, the 50-day is flat – has been that way for a couple of months now. In fact, it is now slightly pointing down. Contrast this with the Nasdaq 100, where the average is sharply rising. On the S&P 500, it is slightly on the rise but could flatten out.
Similar divergence is also evident elsewhere.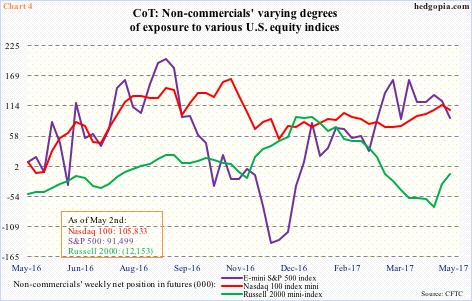
Except for four weeks in which they were slightly net short Nasdaq 100 index (mini) futures, non-commercials have been net long since February last year, perfectly riding the uptrend in the cash.
In Russell 2000 mini-index futures, non-commercials swung from record net long early January to net short two weeks ago which were the highest since September 2014.
And in e-mini S&P 500 futures, these traders have been net long since late December, but lack aggression (Chart 4).
The risk facing Nasdaq 100 longs (cash) is when non-commercials decide to reverse their long bias. These traders tend to be trend followers, and at least for now momentum is strong in the cash.
As extended as the Nasdaq 100 is technically, both 10- and 20-day moving averages are on sharp uptrend.
In fact, that is also the case on the S&P 500. As noted above, the 10-day was defended last week. A breakout is possible. The question is, will there be a follow-through? Better yet, will small-caps join in? In the right circumstances, the Russell 2000 can at least rally to its daily upper Bollinger band – near its all-time high from last month.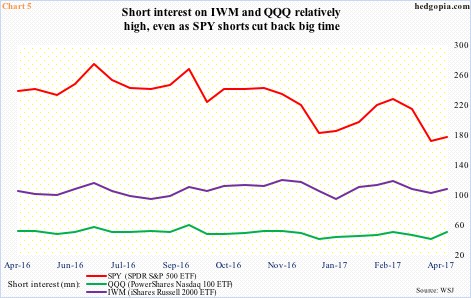
Meanwhile, SPY, the SPDR S&P 500 ETF, shorts are acting as if they expect a breakout in the S&P 500. As of mid-April, short interest stood at 176.6 million, up 3.2 percent week-over-week but from a multi-year low.
From this perspective, QQQ, the PowerShares Nasdaq 100 ETF, can benefit, and it is possible it already has. (End-April numbers will be reported tomorrow.) Mid-April short interest jumped 24.6 percent w/w to 50.8 million – a nine-week high.
And should small-caps get their groove back and the Russell 2000 further build on last Friday’s action, there is fuel for mini-squeeze. Mid-April short interest on IWM, the iShares Russell 2000 ETF, rose six percent w/w to 107.9 million.
That said, any potential help from short interest likely is not lasting.
Taken as a whole, the message coming from these indices is not uniform, which in itself is not much of a confidence booster. It is one thing for money to be shifting around from a risk-on sector to a risk-off, but it is another when small-caps are lagging and techs are rallying. They are both risk-on, and one is diverging from the other.
Thanks for reading!
