
Signs of fatigue are showing up in US equities. It began with large-caps, and now there are early signs it is spreading to small-caps as well as tech.
The small-cap switch was turned on right after Donald Trump was elected US president in November 2016. Since November 8 that year, the Russell 2000 small cap index has rallied 41 percent. In contrast, the Dow Industrials is up 34.1 percent and the S&P 500 large cap index 28.8 percent. Post-election, the Nasdaq 100 index logged gains of 49.8 percent, but it is more of a late bloomer.
Year-to-date, the Nasdaq 100 is up 12.5 percent, versus 9.8 percent for the Russell 2000 and three percent for the S&P 500. The Dow, in fact, is down 0.6 percent year-to-date.
Small-caps benefited from two distinct tailwinds – real or perceived. Right after the election, their domestic focus was regarded as a primary beneficiary of Trump’s promises to cut taxes and regulation as well as increase infrastructure spending. In recent months, as tensions have risen between the US and its trading partners, small-caps – once again, rightly or wrongly – are thought to be less sensitive to trade wars.
All these indices – and others – peaked late January, followed by a sharp drop then a reversal low on February 9 (arrow in Chart 1). Of the major ones, the Nasdaq 100 was the first to surpass its late-January high. But turns out only fleetingly. The decline after making a new high on March 13 stopped with a higher low.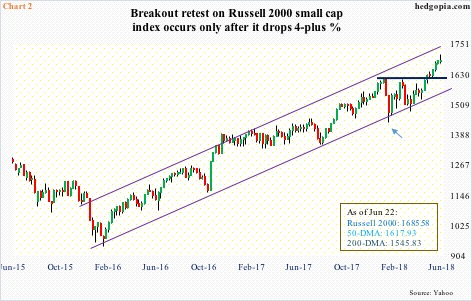
Post-February 9 low, the pattern of higher lows also formed on the Russell 2000 (arrow in Chart 2). Mid-March, the index retreated from just short of its late-January high of 1615.52. The breakout occurred mid-May. Since then through last Wednesday’s fresh high of 1708.10, it already rallied 5.7 percent. Of the major indices, the Russell 2000 is the first to sustainably rally to a new high. The Nasdaq 100 achieved that feat as well, but (1) much later and (2) it surpassed the mid-March high by only 1.7 percent before retreating last week.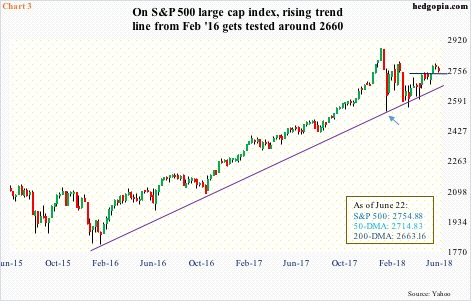
Throughout all this, the S&P 500 lagged. It is yet to surpass its late-January high. Since the February low (arrow in Chart 3), it has made higher lows. But this has been accompanied by lower highs as well. After peaking at 2872.87 on January 26, the intraday high of 2791.47 on the 13th this month was lower than 2801.90 on March 13.
Two weeks ago, the S&P 500 flashed a weekly doji. This was followed by a 0.9-percent drop last week. The index broke out of a three-week rectangle three weeks ago. Last week, the breakout was retested – successfully thus far. Odds favor more weakness lies ahead, particularly if weekly overbought conditions begin to unwind.
Fatigue in large-caps may now be spreading to tech and small-caps.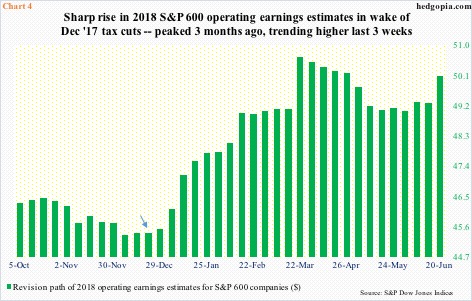
First of all, as long as the Russell 2000 stays above the mid-May breakout, technicians might be eventually eyeing another 6.5-percent rally to fulfill a measured-move target derived from the January high-February low. This may or may not fulfill, time will tell. This much we know. Small-caps act well.
In recent weeks, the revision trend for 2018 S&P 600 small cap operating earnings estimates has improved. They peaked at $50.66 as of March 22. So the latest estimate of $50.08 is still below that high, but has trended higher since bottoming at $49.04 at the end of May. Sell-side estimates took off after the Tax Cuts and Jobs Act of 2017 was signed into law on December 22. As of December 21, they had penciled in $45.41 for this year (arrow in Chart 4). Next year, they expect $61.40. Even if these estimates come through – big question mark for next year in particular – stocks are not going to rally in a straight line.
Last week, the Russell 2000 rose to a new high, but only to see sellers show up in the next two sessions. The week produced a candle with a long wick. On both daily and weekly basis, momentum indicators are overbought.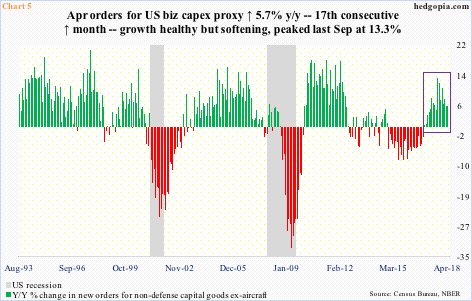
This is also true with the Nasdaq 100. As mentioned earlier, it has by far led its peers this year. This comes amidst okay to sluggish capital expenditures, so bears suspect if this tech strength has staying power. Nonetheless, price is telling us otherwise.
Orders for US non-defense capital goods ex-aircraft – proxy for business capex plans – were up 5.7 percent year-over-year in April to a seasonally adjusted annual rate of $67.1 billion. (May’s numbers are due out Wednesday.) The cycle high $70 billion was reached in March 2012. Since reaching $69.5 billion in September 2014, orders dropped all the way to $59.3 billion by March 2016, before recovering. Growth is in deceleration, with y/y rise softening since 13.3 percent last September.
After four straight positive weeks, the Nasdaq 100 (7197.51) produced a weekly long-legged doji last week. This showed up at an interesting place. Since the February low, the index has made higher lows and higher highs. The upper bound of this ascending channel was just tested. The daily chart just formed a potentially bearish MACD cross-under. The path of least resistance at least near term is down. Nearest support lies at 7000, and after that 6550, which is where the lower bound of the aforementioned channel rests.
On the S&P 500 (2754.88), the 50-day moving average lies at 2714.83. Around 2700, a rising trend line from early February lies. Then there is the 200-day (2663.16), which is where a trend line from February 2016 extends to (Chart 3). On the Russell 2000 (1685.58), breakout retest takes place at 1615-ish, which now approximates the 50-day (1617.93).
In each, as long as these levels hold, the ball stays with the bulls.
Thanks for reading!
