
After a three-month 17-percent drop, EEM, the iShares Emerging Markets ETF, looks ripe for an options trade.
On May 22, 2013, Ben Bernanke, then-Fed chair, suggested that the Fed would begin tapering back nearly $70 billion in monthly purchases of bond and mortgage-backed securities. Interest rates immediately came under upward pressure. The 10-year Treasury yield rose by nearly a full percentage point through early September that year. EEM, already under slight pressure, proceeded to lose nearly 18 percent in the next month.
U.S. quantitative easing (QE) has been good to emerging markets, attracting tons of carry trade dollars. In a carry trade, investors borrow at a lower rate and invest the proceeds at a higher rate. The risk facing beneficiary markets/countries is when the trade unwinds. Hence the sell-off in EEM back then during what is now known as the taper tantrum. Hot money fled.
A similar phenomenon unfolded early April this year; 10-year yields rose from 1.84 percent to 2.49 percent late June. EEM peaked late April, before dropping north of 17 percent in the next three months. Several FOMC officials have been vocal about wanting to raise rates this year, if economic data cooperate.
There are three more FOMC meetings left this year, with press conferences scheduled for September and December. The ECI wage data last week was discouraging. This Friday, we get the jobs report for July and on September 4 for August. If these two reports do not cooperate, FOMC hawks would have lost even a scintilla of argument for a September hike. Of late, momentum has been missing in jobs. In two of the four months through June, non-farm jobs have been sub-200,000, with the monthly average in the first half of 208,000. In May and June, the six-month average has crossed below the 12-month average (245,000). In 2014 the monthly average was 260,000.
Therein lies the rub. Data have been struggling to cooperate with a rate-hike scenario.
Last week, from durable goods and pending home sales for June to GDP and ECI for the second quarter, they all came in weaker than expected. Between Wednesday’s low to Friday’s high, TLT, iShares 20+ Year Treasury Bond ETF, rose 2.1 percent.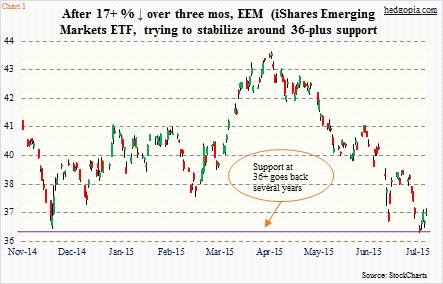
Amidst all this, EEM is trying hard to stabilize.
As seen in Chart 1, the drop since late April has been nasty. Currently, essentially all the moving averages are pointing down. In fact, in the third week of July, the ETF suffered a death cross – the 50-day moving average crossing below the 200-day – followed by a quick drop of nearly six percent.
At first glance, there is nothing to like in Chart 1. It is in need of repair, and that takes time. A deeper look reveals a slightly different picture – at least near-term. Support at the 36 range goes back several years. And buyers are beginning to show up. This is taking place even as daily and weekly momentum indicators are oversold, particularly the former.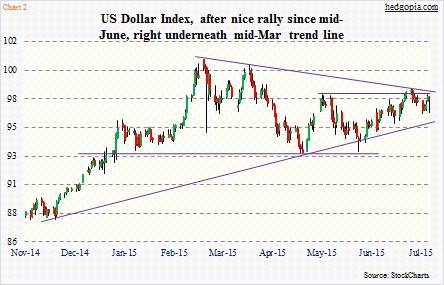
Interestingly, the US Dollar Index currently sits right underneath the mid-March trend line (Chart 2), and looks to be looking to digest the five-plus-percent one-month rally into the third week of July.
EEM historically tends to track inversely with the dollar (Chart 3). There are of course exceptions. The US Dollar Index got on a rip-roaring rally in July last year. EEM followed the greenback, but only until last December. Also during the taper tantrum, the dollar and EEM moved in tandem. After Mr. Bernanke’s May 22nd announcement, the US Dollar Index lost nearly five percent in the next three weeks. One would think higher interest rates would help the buck.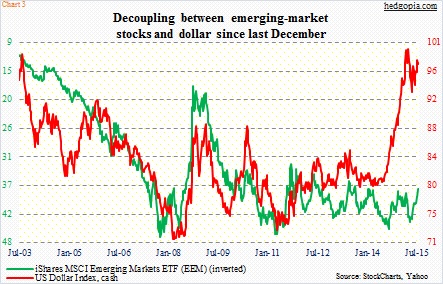
Nonetheless, can a catch-up trade occur on EEM so the gap is filled between the red and green lines on Chart 3? Always possible. For that scenario to come to pass, the ETF probably needs to break $36-plus. Importantly, EEM broke the October 2011 trend line last month (Chart 4). (In the chart, the monthly close is used, hence the July low which tagged that support is not seen.)
At least for now, it does not look like EEM ($37.12) will lose $36. With that said, with the kind of pressure it has been under since late April, it will take time before moving averages, among others, stabilize.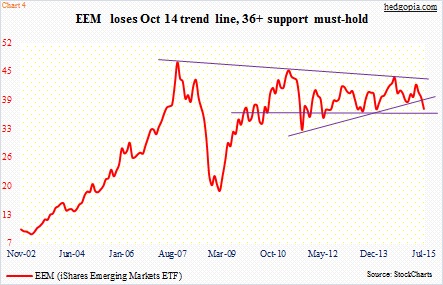
With this in mind, EEM looks ready for a buy-write strategy, in which a long position is established, against which out-of-the-money calls are written instantly. Hypothetically, weekly August 7th 37.50 calls fetch $0.22. Most likely, the short call does not get exercised this week, as the ETF continues to consolidate. The premium then goes toward reducing the cost to $36.90. If exercised, however, it will yield a profit of $0.60.
Thanks for reading!
