
- Encouraging signs of near-term bottom
- VIX unable to break past 17; several other indicators grossly oversold
- Medium-term risks remain; SPX, DOW, RUT, NYSE have broken late-2012 trendline
The Dow Industrials and the Nasdaq Composite yesterday successfully tested trendline support going back two to three years. Several of the other indicators this blog tracks are also fast approaching oversold conditions – though far from a washout – that in the past have marked a bottom in stocks. While these are makings of at least a near-term bottom, trendline break on some other indices suggest more important test lies ahead. 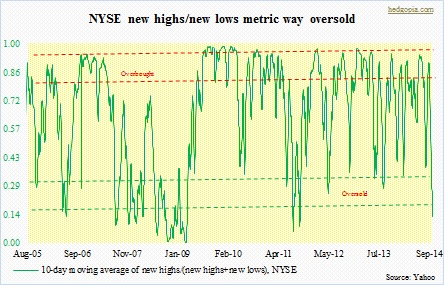
Large-caps finally caught up with small-caps. The latter, represented by the Russell 2000 small cap index, started deteriorating much earlier – peaked early March, which was retested early July and failed. From recent peak to intra-day trough yesterday, the index was down 11-plus percent – in “official correction territory”. Whatever that means, and whoever decides it. Nevertheless in recent months small-caps had been lagging their large-cap brethren by a wide margin. For the year, the S&P 500 large cap index is up five-plus percent, while the RUT is down nearly six percent. Investors have clearly been hiding in large-caps. On the S&P 500, even after a 4.6-percent drop off its recent all-time highs until the intra-day trough yesterday, 61 percent of the constituents are still above their respective 200-day moving average. Here is a silver lining for the bulls. This is also a level that back in February and August this year coincided with the end of minor correction in stocks, followed by fresh new highs in subsequent weeks and months. At first glance, conditions between now and then look similar. 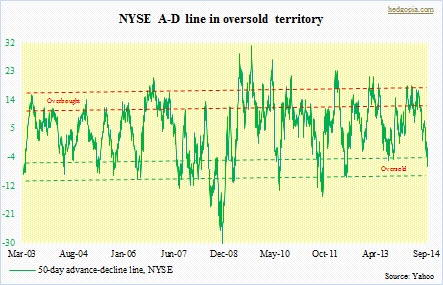
On close examination, there are some crucial differences. The junk-bond market was not as jumpy back then. Small-caps had not yet lost their luster. Yes, they were beginning to lag, but the much-talked-about death cross had not even crossed anyone’s mind back then. There were less jitters all around. Period. Particularly in the euro zone, economic data points were giving out signs of improvement, versus in recent months in which they have persistently disappointed. The Fed was not as close to ending its QE, even as Mario Draghi dropped a signal here a signal there that he was prepared to do more. We found out yesterday morning that he was more talk and less action. But let us get real. His hands are tied. We know that. Germany in all probability is not going to acquiesce to a full-fledged QE. Draghi’s “whatever it takes” pledge back in 2012 has done wonders to euro zone credit (lower yields across the board), currency (lower euro, good for exports) and stocks (economy not benefiting from wealth effect, though). All this, without much tangible action, just verbal! The ECB’s balance sheet is €1tn lighter versus back then. Sooner or later, the markets will call his bluff. That is for sure. 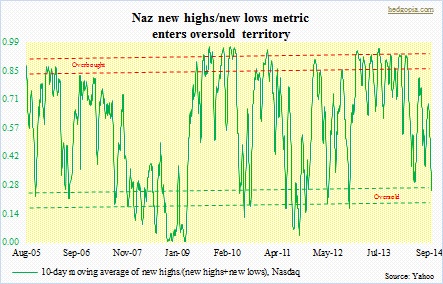
Here is another crucial difference between now and then. None of the major U.S. indices has so far broken the 2009 trendline. A good thing. On the RUT (1096 yesterday), depending on how one draws it, it lies between 1000 and 1050, between 1700 and 1750 on the SPX (1946), between 3800 and 3900 on the Naz (4430), near 9400 on the NYSE Composite (10556) and just under 16000 on the Dow (16801). (One can also argue that the NYSE broke that trendline in 2011. Beauty is in the eye of the beholder.) However, shorter-length trendlines have been broken. The SPX, the Dow and the NYSE have broken their respective late-2012 trendlines – the first two this week and the latter in July. The Naz bounced off that trendline yesterday, while the Dow bounced off its late-2011 trendline. This is important, but even more important is this. What the bulls do not want to see happen is a rally attempt that fails at where things broke down – 1960-1965 on the SPX, 10800 on the NYSE, and 17150 on the Dow. The Dow already did a test of its late-2012 trendline last month and failed. That is exactly how things transpired on the RUT. It broke that trendline in April, tested the underside of it in June, failed and we know the rest. 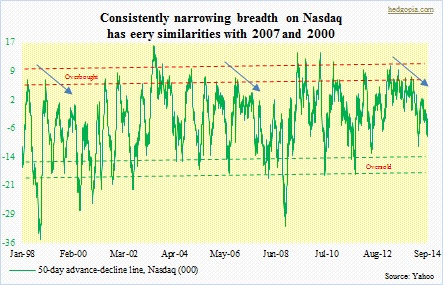
For now, here is the good news.
The NYSE in particular looks grossly oversold (the first two charts), while the Naz is getting there (the bottom two), even as the VIX continues to flash a spike-peak signal. There is probably a lot of money that wants to go long at/near 200-day moving average, which is not too far away from here — 1901 on the SPX, 4291 on the Naz, and 16573 on the Dow. (The NYSE and the RUT are already below that.) For indices that are still above that average, a successful test would be ideal.
