
On FOMC day, major equity indices posted fresh highs. Bulls were assured by Chair Powell that the Fed will start tapering but is in no rush to take the interest-rate punch bowl away.
Yet another session, yet another high! On FOMC day, major equity indices all rallied to fresh highs. Large-, mid- and small-caps – all of them.
Bulls obviously interpreted yesterday’s tapering announcement as a dovish taper. As expected, the Fed later this month will begin to taper its bond purchases by $15 billion a month. Currently, it buys up to $120 billion in treasury notes and bonds ($80 billion) and mortgage-backed securities ($40 billion).
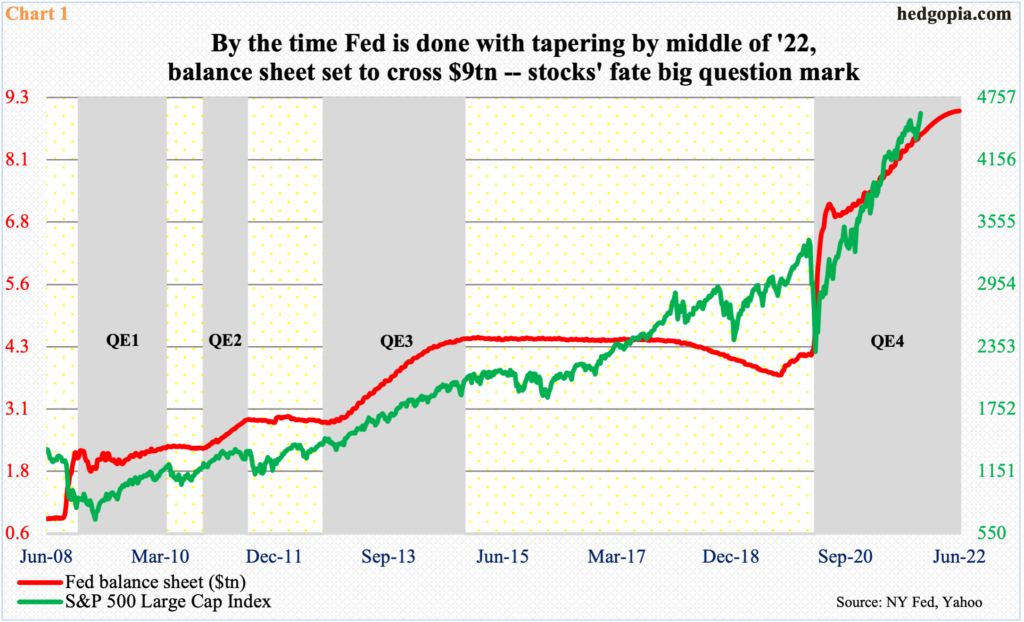
The balance sheet more than doubled from $4.24 trillion in early March last year to $8.56 trillion. By the middle of next year, when tapering is done and the Fed stops buying these securities, its assets would have ballooned to north of $9 trillion.
At the press conference yesterday, Chair Jerome Powell said the Fed can be patient in raising interest rates. That assurance probably boosted risk-on sentiment. But the fact remains that tapering amounts to less and less liquidity from the central bank. In past iterations of quantitative easing, this hurt stocks. Even if history were to repeat itself, there is several months before the bond-buying program were to come to a complete halt. Bulls are obviously hoping the green line in Chart 1 continues to follow the red line higher until the latter flattens out.
In this scenario, crazy can get crazier. Several valuation metrics are already at nose-bleed levels.
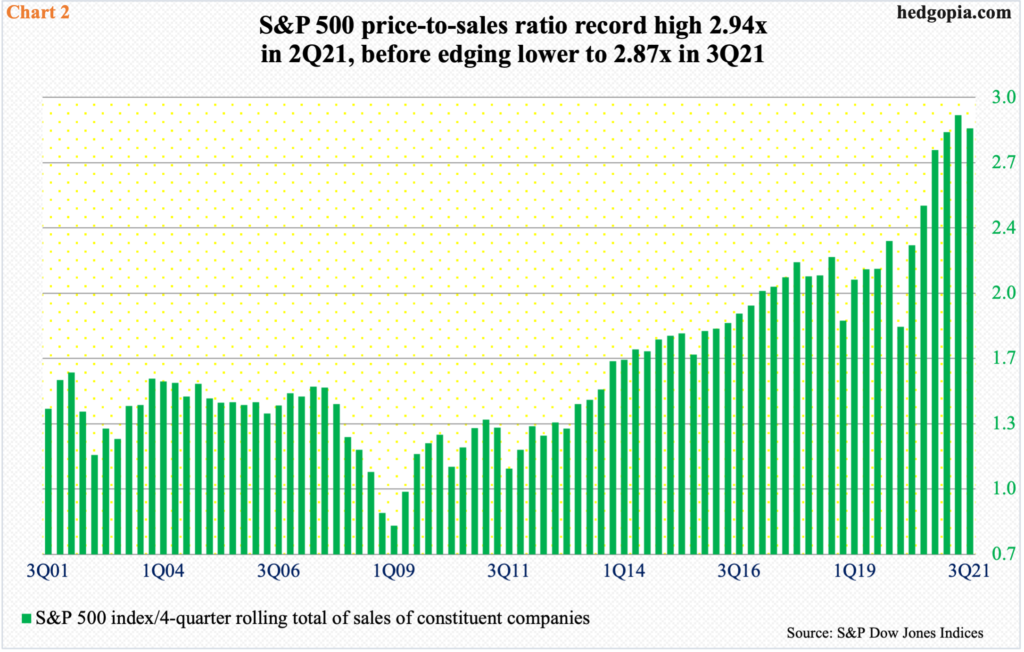
In 2Q this year, the S&P 500’s price-to-sales ratio hit a fresh high of 2.94x before edging lower to 2.87x in 3Q (Chart 2).
In September, the large cap index slid 4.8 percent. As a result, it was only up 0.2 percent in 3Q. But October was quick out of the blocks, up 6.9 percent. With three sessions in, November is up another 1.2 percent. If momentum persists for the rest of the quarter, the price-to-sales ratio is bound to hit another high.
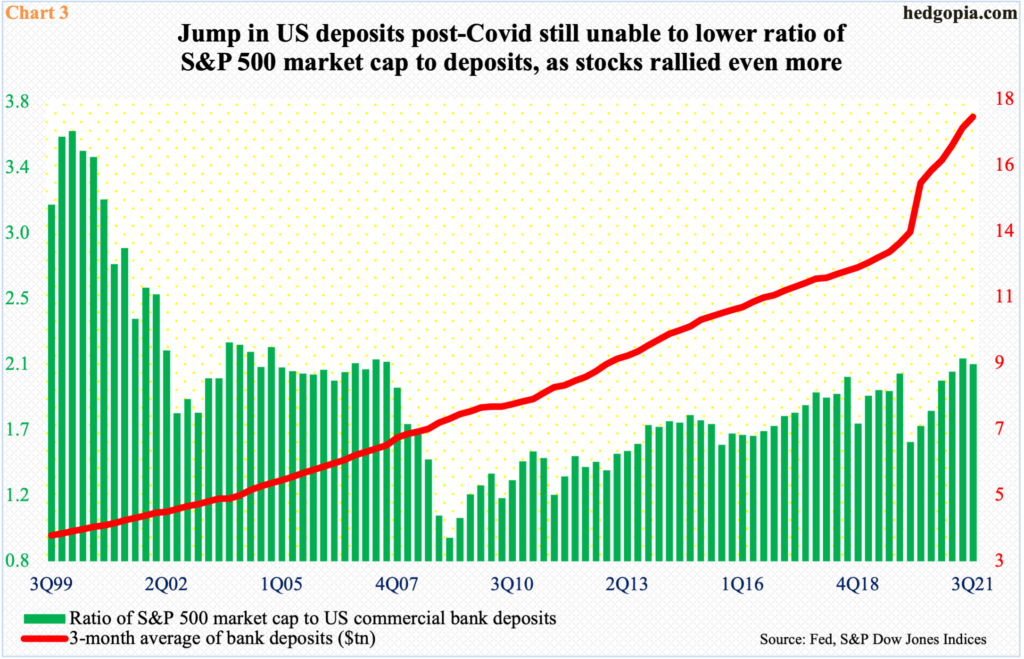
Similarly, deposits at US commercial banks totaled $17.5 trillion in 3Q. At 1Q20, this was $13.9 trillion. It then took off, thanks primarily to government stimulus checks (Chart 3).
Interestingly, even this surge in deposits was not enough to inflict a downward pressure on the ratio of S&P 500 market cap to deposits. At the end of 3Q, these companies were valued at $36.4 trillion, up huge from $21.4 trillion in 1Q20. As a result, the ratio at 2Q21 rose to a 66-quarter high 2.13x, before softening a tad last quarter to 2.09x.
As is the case with the price-to-sales ratio in Chart 2, the ratio of S&P 500 market cap to deposits can rise in the current quarter if momentum in stocks persists in November and December. Ironically, the ratio was much higher in the dot-com bubble era, peaking at 3.62x in 1Q00 (Chart 3). It should surprise no one if the bulls begin to argue things are nowhere nearly as stretched hence have room to go higher. As things stand, the Fed is in no mood to take the punch bowl away.
Thanks for reading!
