
Things are fluid – very fluid. Headlines are changing fast, so is market reaction. From currency to trade to Fed policy to the economy, traders are having a hard time keeping up. Technicals help particularly in times like this. The collective wisdom of markets can help participants take a gauge of if bulls and bears are winning at any particular moment. In the last several sessions, momentum has shifted bears’ way, although bulls tried to put their foot down Tuesday.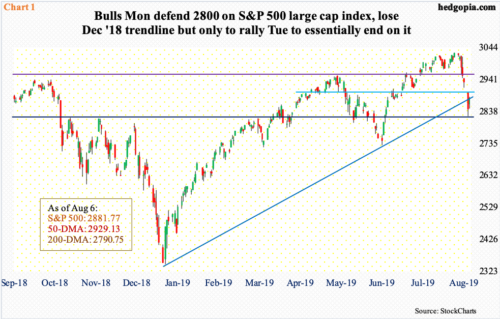
The week started out with Monday’s big decline. Large-caps, mid-caps, small-caps, nothing was spared. The S&P 500 large cap index (2881.77) Monday sliced through its 50-day moving average, losing three percent. As a matter of fact, intraday it was down 3.7 percent, before bids showed up. Bulls stepped up near a crucial level.
Going back to March last year, just north of 2800 has proven to be an important price point (Chart 1). Monday’s intraday low was 2822.12. With three sessions remaining, the weekly has produced a hammer reversal. The daily is oversold and has room to rally. The 50-day lies at 2929. Even before that, there is gap-down resistance at 2900.
On its way to testing 2800, the S&P 500 Mon lost a trend line from December. Tuesday, it rallied 1.3-percent to essentially close on that level. These are the levels to watch for now. Should bulls continue to muster strength, there is decent resistance at 2950s-60s.
The December trend line is a good reference point as major US equity indices put in important lows toward the end of that month. Monday, the Nasdaq 100 index (7521.32) collapsed 3.6 percent and was down as much as 4.4 percent at one time. Bids showed up intraday right on trend-line support from last December (Chart 2).
On its way there, the index lost crucial support at 7700. Immediately ahead, there is gap-down resistance at 7540s, followed by the 50-day at 7663. These are all levels where bears potentially will try to get active.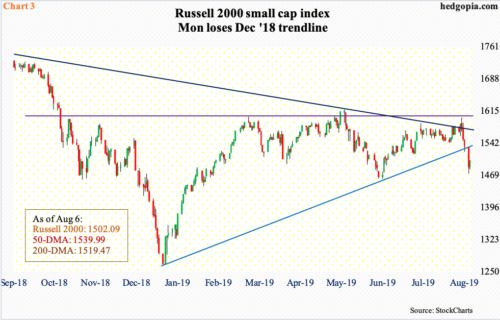
Given the significance of the trend line in question, it is only fitting that bulls are stepping up in defense. Here is the thing. Small-cap bulls, however, failed in that endeavor. Monday, the Russell 2000 small cap index (1502.09) lost that trend line. This speaks volumes about traders’ current apathy toward small-caps. This has been going on for a while now.
After the Russell 2000 bottomed last December, it rallied, but only to get stopped in February at 1600-plus, which since January last year has been a dueling spot for bulls and bears. Most recently, bulls were denied at that ceiling last Wednesday. Before bulls can think about testing that resistance again, they have to first jump over several other hurdles.
The underside of the broken trendline in question will be tested at 1530s (Chart 3). This approximates the 50-day at 1540. Before that lies the 200-day at 1519. It is only after all this resistance is taken care of can bulls think about testing trend-line resistance from last August at 1560s.
Importantly, on all these three indices – and others – there is room for the daily to rally, which is what bulls will be trying to cash in on in the sessions ahead. Bears, on the other hand, are salivating over overbought weekly indicators that are in the midst of getting unwound.
Thanks for reading!
