
It is a seasonally strong period for stocks. Bulls are wasting no time getting ready for this. Stocks are rallying. In the best of circumstances, there is room to run still, with the caveat that an important inflation report is due out this Thursday and the inflation-focused Fed meets in the middle of next month.
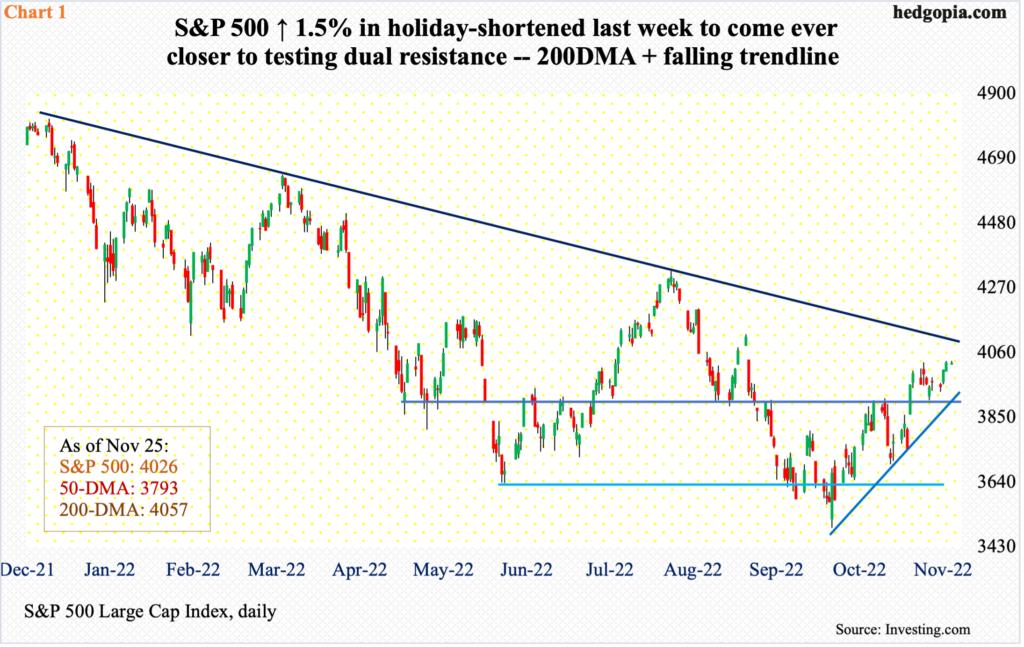
The S&P 500 has trended higher since bottoming at 3492 on October 13. From the January all-time high of 4819 through that low, the large cap index dropped 27.5 percent. Since then, using last Friday’s close of 4026, it has rallied 15.3 percent.
Last week, the index added 1.5 percent. It was a holiday-shortened week and the bulls took advantage of the low-volume, dull trading. Most recently, they defended the 10-day moving average on the 17th, as the S&P 500 dropped to 3907, which also approximates lateral support at 3900. Momentum has been higher since.
The way it is setting up, the index could very well try to test the 200-day moving average, which at 4057 is a stone’s throw away. Right around there – or just above – lies a falling trend line from the January high (Chart 1). This is going to be a crucial test for the bulls.
Since the October bottom, investor sentiment has firmed up but is nowhere near getting extended.
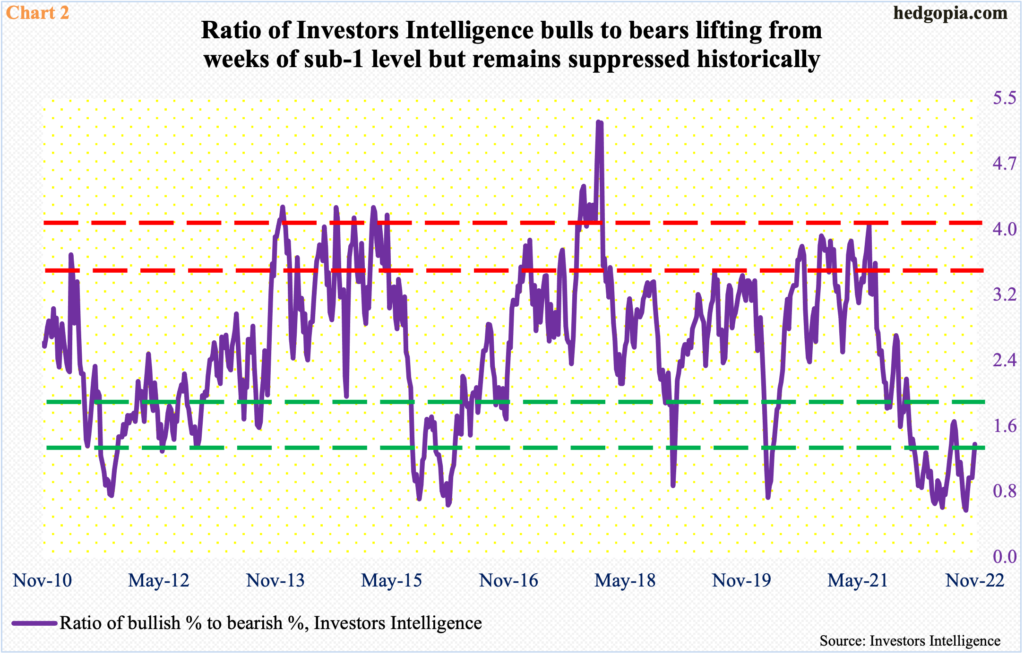
The Investors Intelligence bullish percent troughed at 25 percent in the week to October 11, which was the lowest reading since February 2016; in that very week, bears jumped to 44.1 percent, which matched June’s reading and was the highest since October 2011.
The point is, when the S&P 500 bottomed last month, investor sentiment was beginning to register extreme readings. As is the case historically, it is just a matter of time before this gets unwound, and this is happening.
In the week to last Tuesday, bulls rose 3.1 percentage points week-over-week to 41.7 percent – a 13-week high – even as bears slid 2.3 percentage points to 30.5 percent, which was a 10-week low. As a result, the bulls-to-bears ratio came in at 1.37, which has lifted from eight consecutive weeks of sub-one readings, but remains in oversold territory historically (Chart 2).
Bears are also retreating elsewhere.
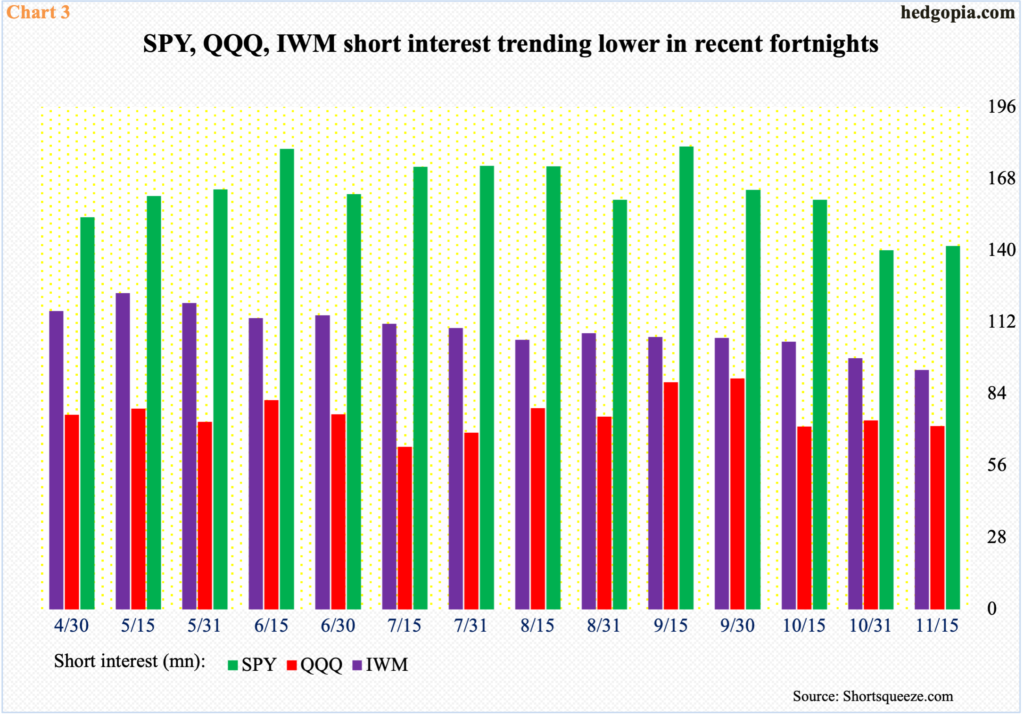
Short interest on the three major ETFs corresponding to the S&P 500, Nasdaq 100 and the Russell 2000 small cap index – SPY, QQQ and IWM respectively – has been trending lower of late.
Mid-November, SPY short interest rose 1.1 percent from October-end to 141.8 million, but it is down 21.5 percent from mid-September. Likewise, QQQ’s is down 20.6 percent from September-end to 71.6 million, while IWM’s is down 24.3 percent from mid-May to 93.4 million (Chart 3).
As shorts left – either covered or got squeezed – this helped create a positive tailwind for these ETFs, and obviously for the indices they represent.
The bigger question is, with all the uncertainties out there, will there be – or are there – investors willing to buy at higher prices to play the seasonality game?
Inflation remains front and center.
The PCE (personal consumption expenditures) price index for the month of October comes out this Thursday. Core PCE is the Federal Reserve’s favorite.
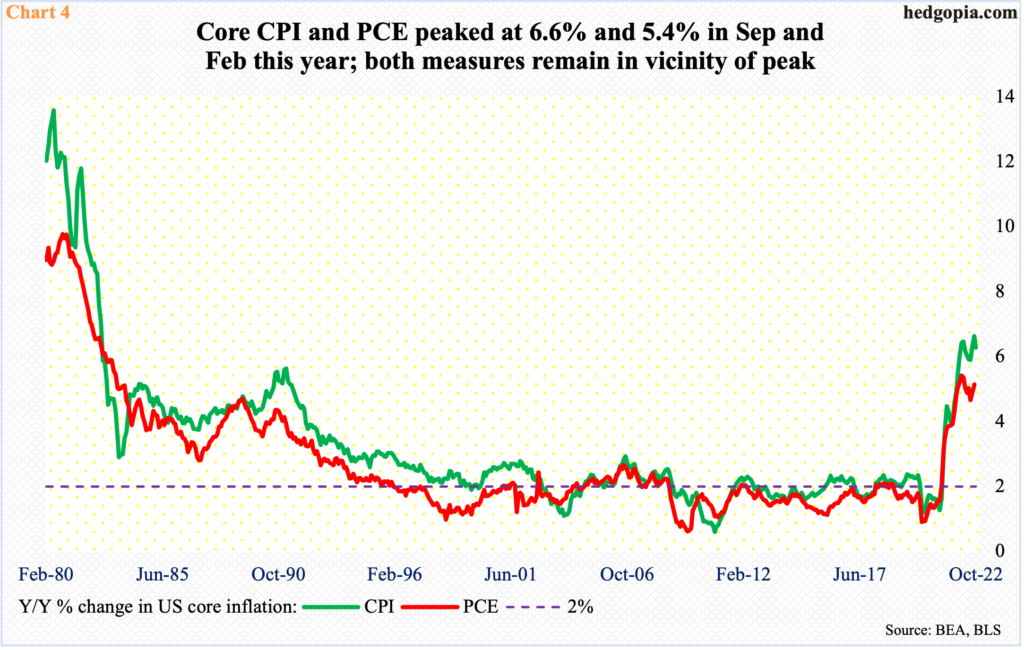
October’s CPI (consumer price index) was released on the 10th this month, and core CPI increased 6.3 percent year-over-year, slower than September’s 6.6 percent, which was the steepest since August 1982.
Core PCE peaked a little earlier, having risen 5.4 percent in the 12 months to February – the sharpest rise since April 1983 (Chart 4); in September, it increased 5.1 percent.
When October’s CPI came out, it was better than expected at the time, and stocks shot up in response. It remains to be seen if markets will continue to award a report that is, let us say, a tenth of a percent lower than expected.
In a larger scheme of things, inflation remains very high, and this is what is driving the Fed’s monetary policy at the moment.
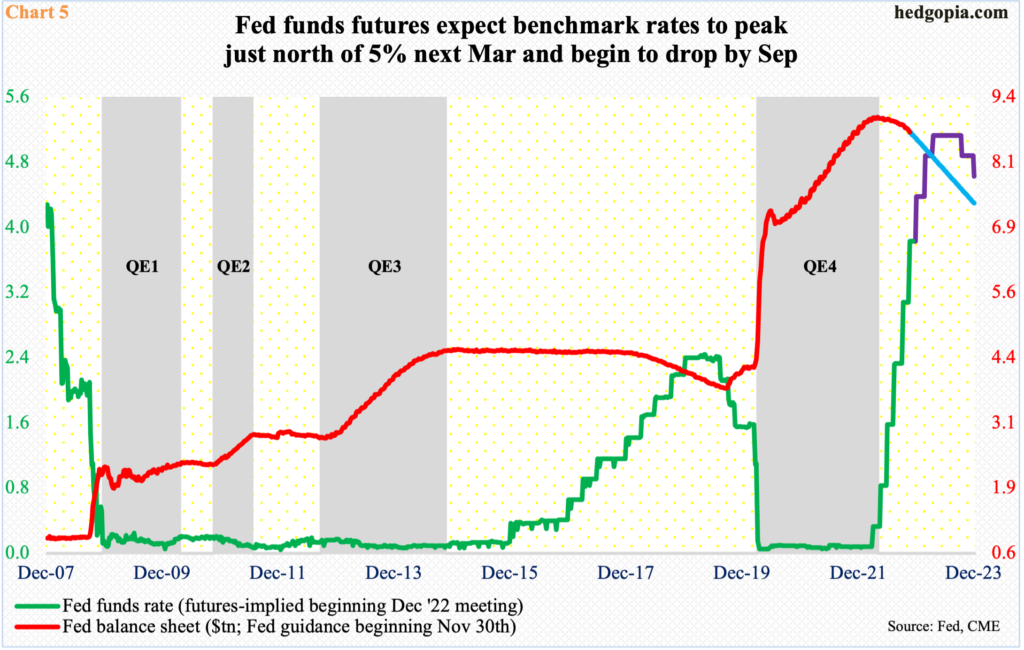
The central bank next meets on 14-15 next month. This will be the year’s last scheduled FOMC meeting. After October’s CPI, futures traders have priced in a 50-basis-point increase in the fed funds rate next month; earlier, they were straddling between a 75 and a 50. Several FOMC members concur with a step-down in their tightening posture. The central bank is also reducing its bloated balance sheet.
A 50 will have come after four consecutive 75-basis-point hikes. Rates have gone up a lot since this March, when the benchmark rates remained in a range of zero to 25 basis points, versus the current 375 basis points-400 basis points.
Futures traders also expect the fed funds rate to peak just north of five percent by next March and the Fed to begin to lower beginning September (Chart 5). This is big, should it come to pass. This is not the message coming from Chair Jerome Powell, who, along with other FOMC hawks, continue to maintain a ‘higher for longer’ message. Equities probably would not want to hear a reiteration of this posture from him in two weeks – particularly considering the rally the past month and a half.
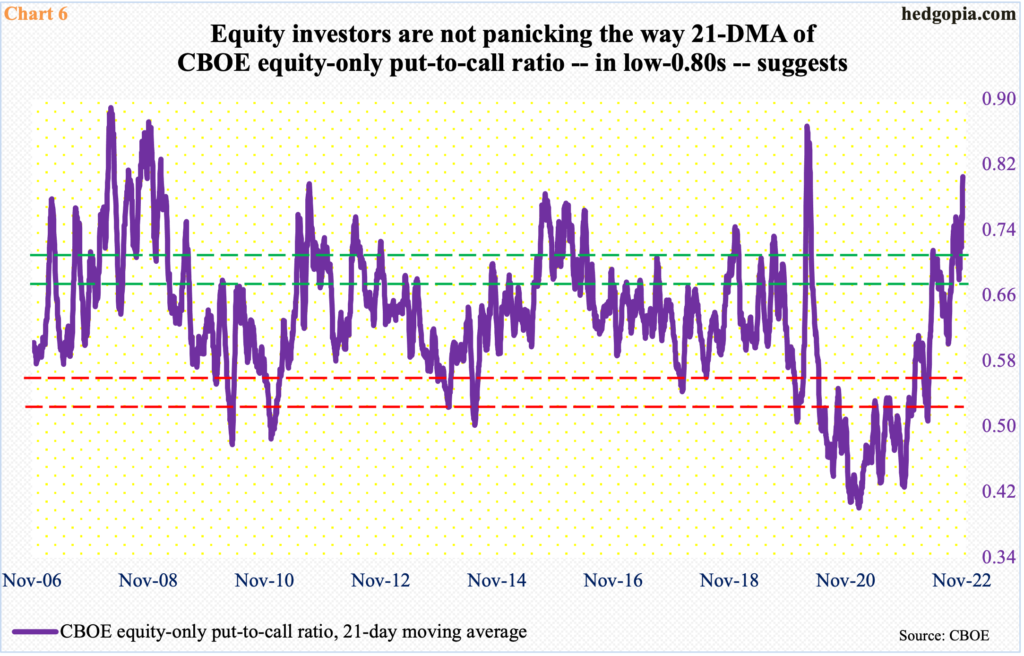
Amidst this, the options market is sending a rather weird message. A 21-day moving average of the CBOE equity-only put-to-call ratio printed 0.804 last Friday, having come on the heels of Wednesday’s 0.805. This is overbought territory, as Chart 6 shows. Unwinding of this tends to help equities – big time. On March 20, 2020, for instance, the ratio peaked at 0.867, and we know how stocks rallied after that.
There is this, though.
Since the 2nd (this month), the straight ratio has produced four readings of one or higher – 1.14 on that date, 1.30 on the 8th, 1.46 on the 16th and 1.35 on the 22nd. Historically, this is panic territory. But there is no panic in the market – not now anyway; there was some in early October.
Strangely, in two of the four sessions – on the 8th and the 22nd – the S&P 500 rallied; it is hard to produce such panicky readings when stocks end up in the green. The index suffered a minor drop on the 16th and dropped a decent amount on the 2nd.
The bottom line is that there is confusion – or a lack of conviction, for lack of a better term. Right here and now, the bulls are staring at an extended S&P 500 – on the daily in particular. They would have strengthened their case should the index drops back to test 3900 and this aggressively gets viewed as a buying opportunity.
Thanks for reading!
