
After a slight breach of support in the week before, both small- and large-cap bulls put their foot down last week. This came after weeks of selling pressure. There is more room to run. Non-commercials are aggressively short and can unwillingly help.
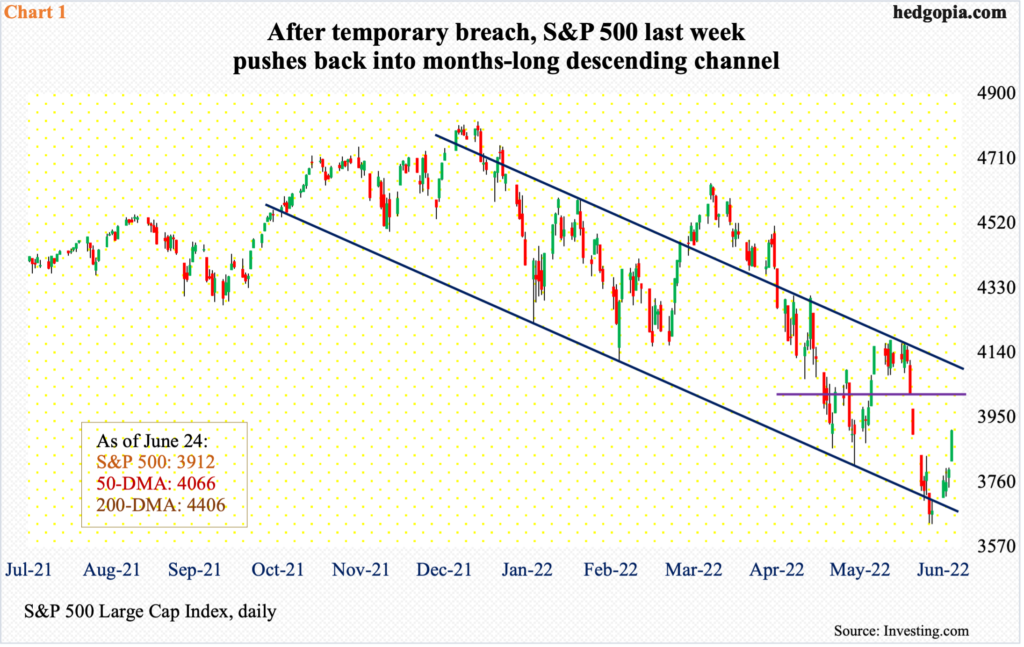
The S&P 500 tumbled 24.5 percent between the January 4th high of 4819 and the June 17th low of 3637. Along the way, several supports got compromised, including a descending channel from late last year/early this year (Chart 1). The breach proved temporary.
Last week, the large cap index rallied 6.4 percent to push back into the channel. This was the first up week in four and second in 12.
Having rolled over on the 8th – only a couple of sessions before the red-hot inflation report for May was published – the index (3912) suffered two gap-downs, one of which was filled by last Friday’s gap-up marubozu; the second gets filled just north of 4000. This is the path of least resistance.
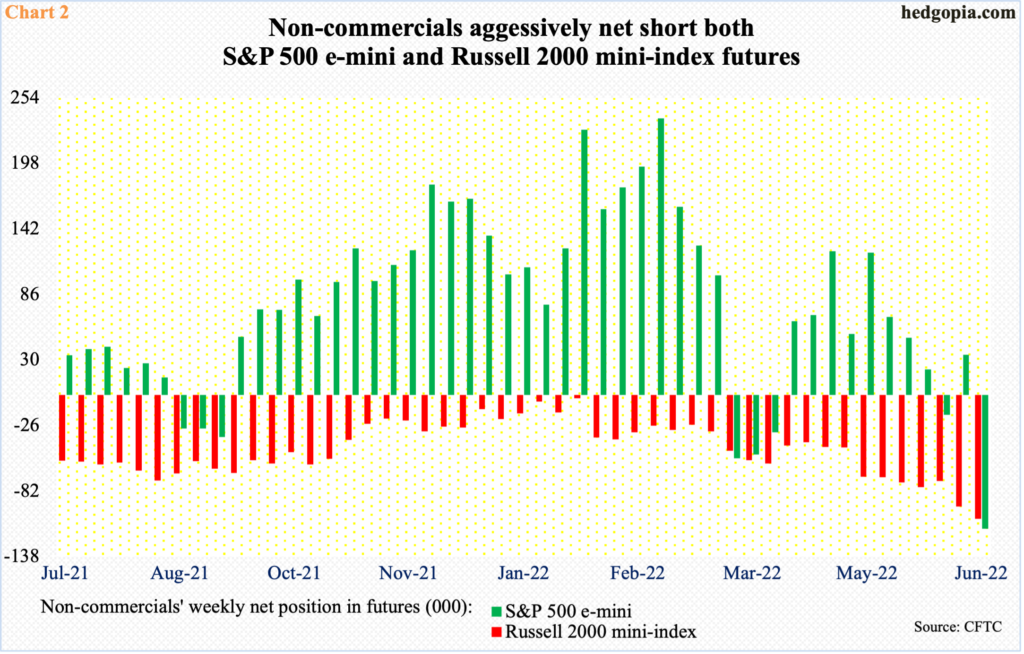
In the futures market, non-commercials can end up helping the bulls.
As of last Tuesday, these traders were sitting at 114,319 net shorts in S&P 500 e-mini futures, up 148,597 contracts week-over-week (Chart 2). They have not been this bearish in the past two years. In the right circumstances for the bulls, short squeeze can occur. In fact, it is very possible this already took place in the latter sessions last week.
Similar dynamics are in play in Russell 2000 mini-index futures. Non-commercials have stayed net short since March last year and have been aggressively adding the past three months. Last week (as of Tuesday), they were net short 105,596 contracts – the highest since September 2008. This could very well prove to be a fuel for squeeze. Time will tell.
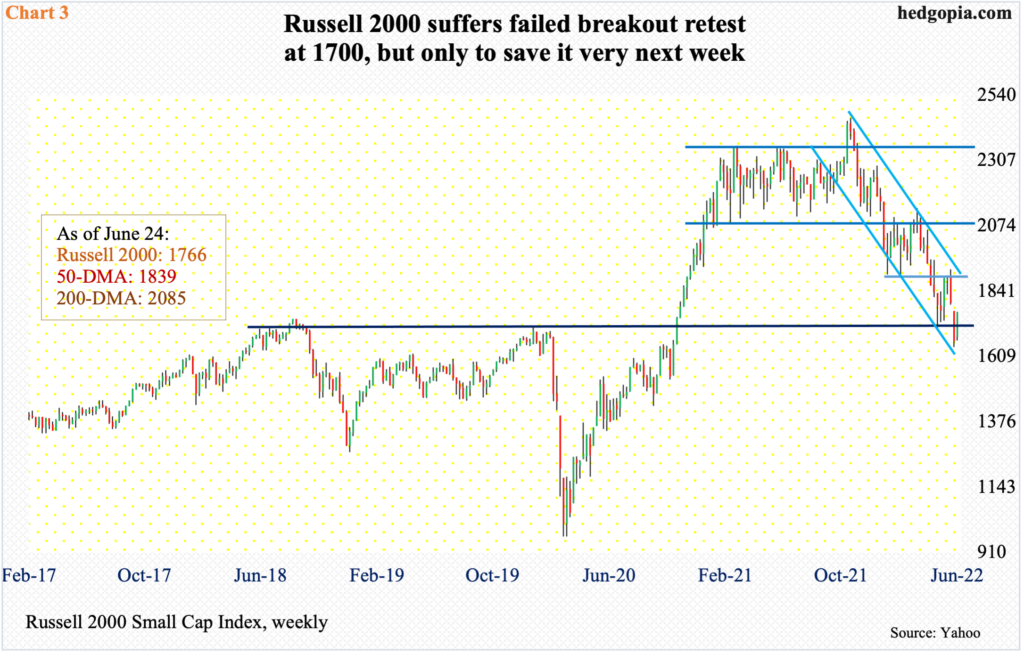
Small-cap bulls just defended a crucial breakout retest from November 2020. In fact, this support was briefly breached in the week before. Last week, the Russell 2000 rallied six percent to end up back above 1700, ending the week at 1766 (Chart 3).
Before this, the small cap index lost 1900 in late April, which was preceded by a major breakdown mid-January, losing 2080s; for 10 months, the Russell 2000 went back and forth between 2080s and 2350s.
As things stand, 1900 is what the bulls would be shooting for. For whatever it is worth, from last November’s high of 2459 through the June 16th low of 1641 – the Russell 2000 cratered 33.2 percent.
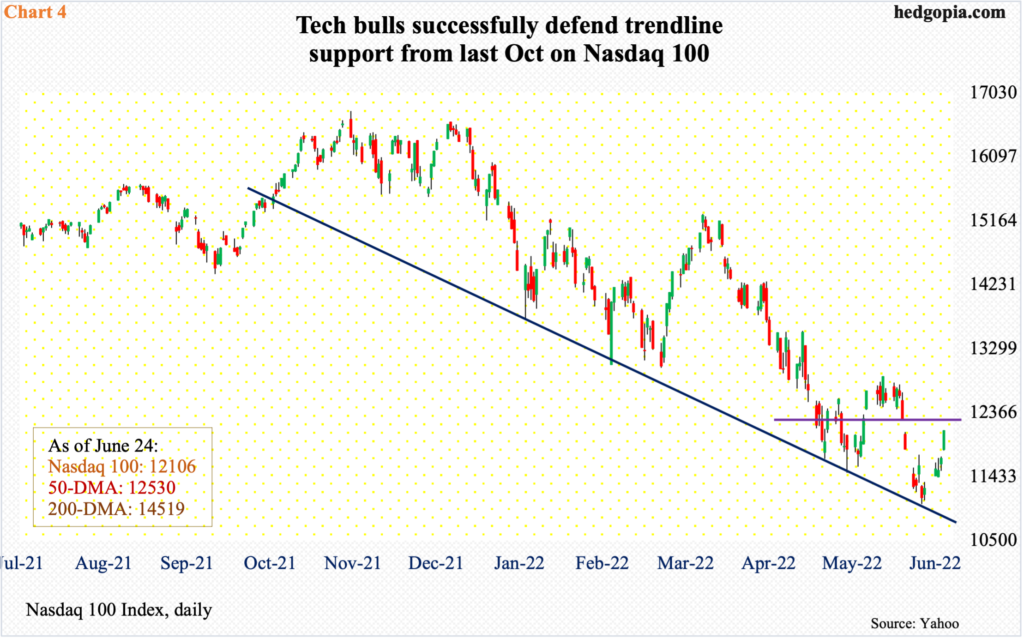
The Nasdaq 100 similarly plunged 34.2 percent from last November’s record high of 16765 through the June 16th low of 11037.
In the week before, a falling trend line from last October was successfully defended. Last week, the tech-heavy index rallied 7.4 percent – its first up week in four and second in 12.
The daily MACD just completed a potentially bullish crossover. Tech bulls now need to push the daily RSI, at 50.7, decisively over the median before upside momentum feeds on itself.
Immediately ahead, there is gap-down resistance just under 12300. Last week, the Nasdaq 100 closed at 12106.
Having been shellacked this year, all these three indices have the potential to continue higher. The 2Q earnings season is just around the corner, and that could prove to be a positive catalyst.
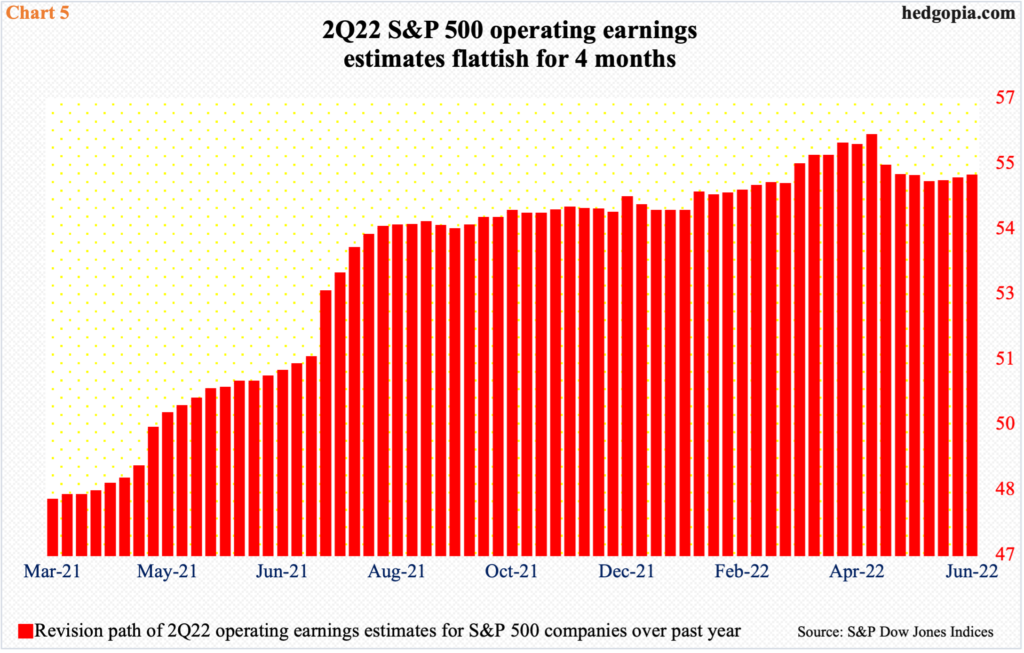
As of June 14, S&P 500 companies were expected to earn $55.10 in the current quarter. The upward revision trend stopped at $55.97 in late April. In fact, estimates have just about gone sideways the past four months (Chart 5).
The bar may not be low but is not elevated either given the recent revision trend.
Thanks for reading!
