
In a market that is too top-heavy, large-cap equity indices are struggling to decisively break out to new highs.
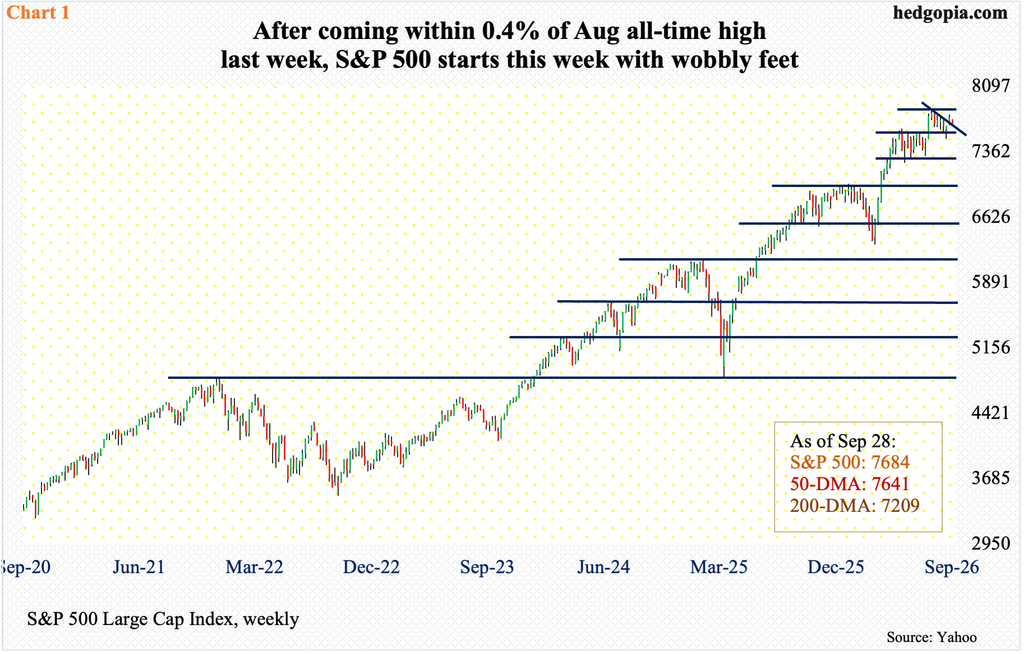
At last Tuesday’s intraday high of 7782, equity bulls rallied the S&P 500 within 0.4 percent of the all-time high of 7817 posted on August 13, ending the week at 7743. Since that high, the large cap index made a series of lower highs; the pattern was broken last week. This was preceded by five successive weeks of defense of 7600-plus, which is proving to be a crucial level.
The S&P 500 earlier consolidated for a couple of months after peaking at 7621 on June 2, with a breakout on August 4. Bulls thus far have defended several retests of this breakout. With this success, bulls at the end of last week were positioned very well to launch an attack this week on its high. Monday, however, disappointed, with the index losing 0.8 percent to 7684.
The 50-day moving average (7641) is right below, not to mention another retest of 7600-plus. It is possible the bulls have for now run out of currency to drive the S&P 500 higher; 7600-plus is a must-hold (Chart 1).
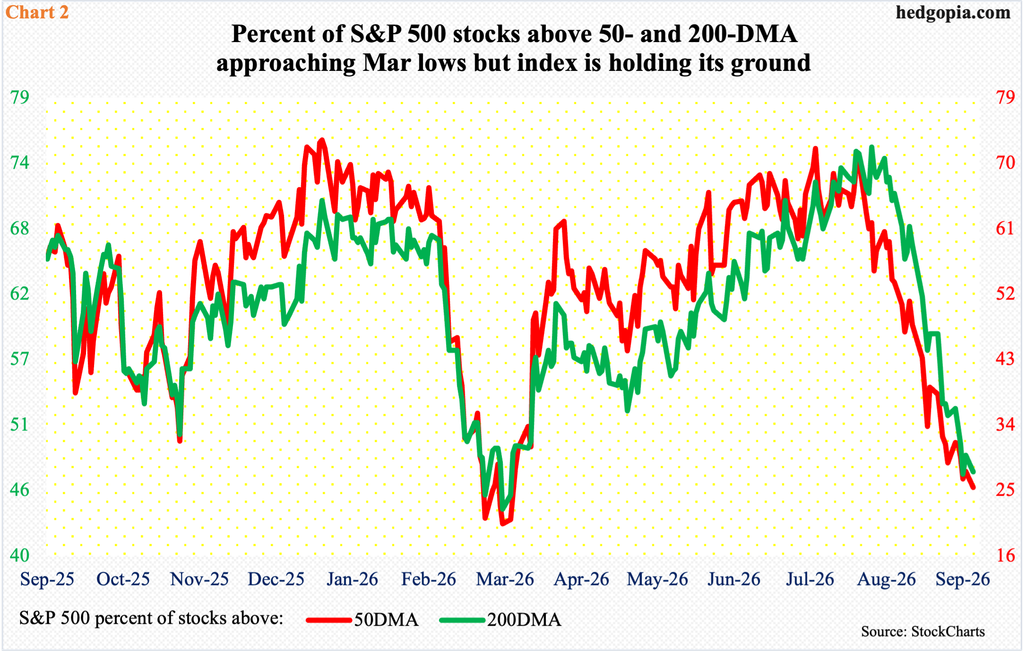
Here is the irony in all this. The S&P 500 rallied 23.7 percent from the March 30 low of 6317 to the August 13 high before coming under slight pressure. By last Tuesday, as previously explained, the index was merely 0.4 percent of that high. Yet, the percentage of stocks above both the 50- and 200-day continued to contract (Chart 2).
On August 19, 75 percent of S&P 500 stocks were above the 200-day; 72 percent were above the 50-day on July 28, with 70.4 percent on August 14. These metrics never followed the index higher subsequently. On Monday (this week), 47.2 percent were above the 200-day and 25.4 percent above the 50-day, with intraday lows of 45.2 percent and 23.8 percent, respectively. These lows are not too far away from late March when the index bottomed; on the 20th, 19.4 percent were above the 50-day, while 44 percent were above the 200-day on March 30. The difference between then and now is that the S&P 500 was down 9.8 percent from its January high before reaching a bottom in March; this time around, it is within earshot of its August high.
Strength clearly is coming from the generals, leaving far behind the soldiers. Historically, this tends not to be healthy, as the generals in due course join the soldiers.
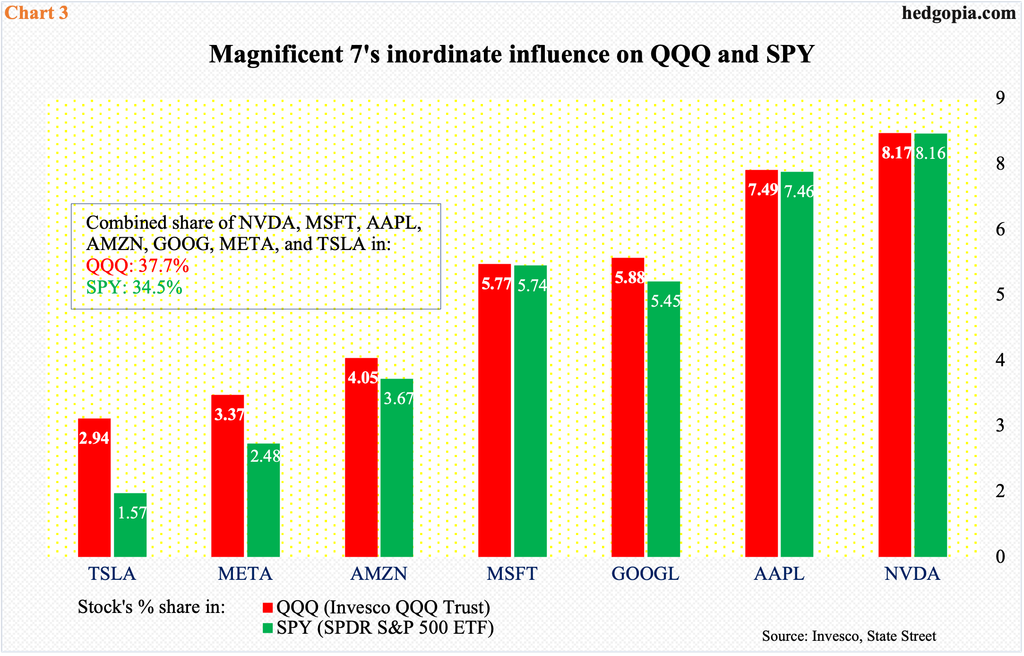
The S&P 500 is weighted by market cap, as is the Nasdaq 100. The large companies thus have a disproportionate influence on these indices (Chart 3). The so-called Magnificent Seven – Nvidia (NVDA, $5.4 trillion market cap), Apple (APPL, $5 trillion), Google parent Alphabet (GOOG, $4.2 trillion), Microsoft (MSFT, $3.8 trillion), Amazon (AMZN, $2.7 trillion), Facebook parent Meta (META, $1.9 trillion) and Tesla (TSLA, $1.5 trillion) – comprise 37.7 percent of QQQ (Invesco QQQ Trust) and 34.5 percent of SPY (SPDR S&P 500 ETF).
Concurrently, small-caps are no longer trading in tandem with the large-caps.
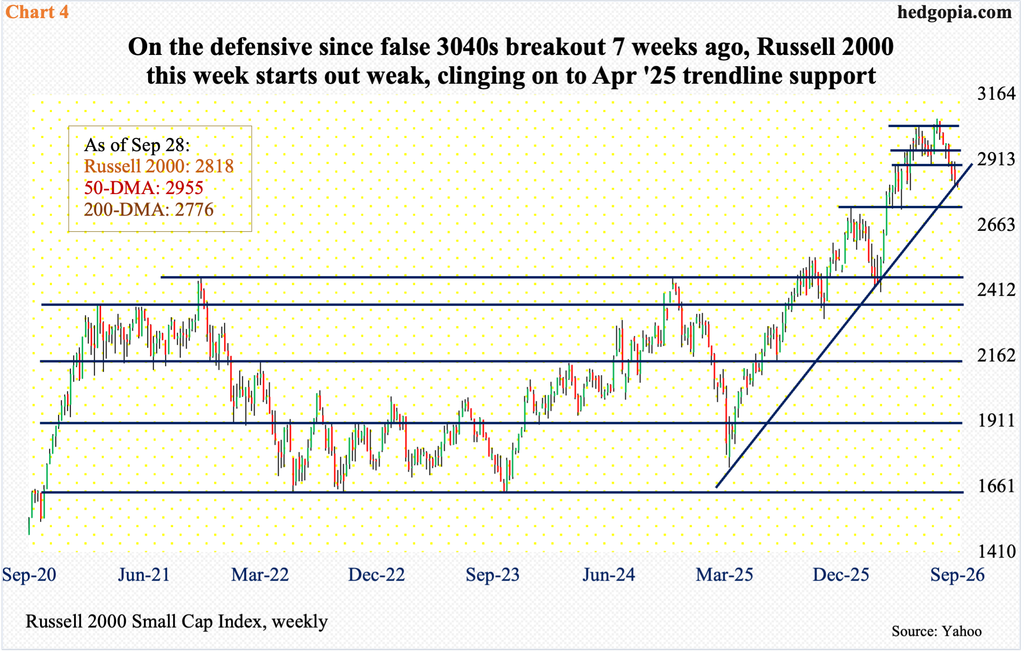
Last week, the S&P 500 rallied 1.2 percent and the Nasdaq 100 3.3 percent, but the Russell 2000 gave back 0.8 percent. This was the third consecutive down week – and fifth in six; on Monday, the small cap index dropped another 0.7 percent to 2818.
The Russell 2000 has been on the defensive ever since it peaked at 3070 on August 14, as, it turned out, the preceding breakout at 3040s was false. This was followed by a loss of horizontal support at 2940s and then 2880s.
The 50-day at 2955 has long been breached. The 200-day at 2776 lies beneath, and a test looks increasingly likely. Small-cap bulls are currently clinging on to trendline support from March 30 when the index bottomed at 2405 (Chart 4).
Small-caps inherently have a large exposure to the domestic economy versus their mid- and large-cap cousins that also have international exposure. They also tend to be leveraged, with more exposure to the short end of the yield curve. Higher rates will hurt.
Interest rates have been rallying. A couple of weeks ago, the fed funds rate was raised by 25 basis points to a range of 3.75 percent and four percent. This was the first hike in a little over three years. The benchmark rate has been left unchanged since last December when it was reduced by 25 basis points; this preceded a cut of similar magnitude in September and October. Earlier, rates reached a cycle high 5.25 percent to 5.50 percent in July 2023, followed by cumulative cuts of 100 basis points over three meetings in 2024. As things stand, futures traders have their money on four more 25-basis-point hikes by next June-July. This would have rolled back 125 basis points of the 175 basis points of easing in the prior tightening cycle.
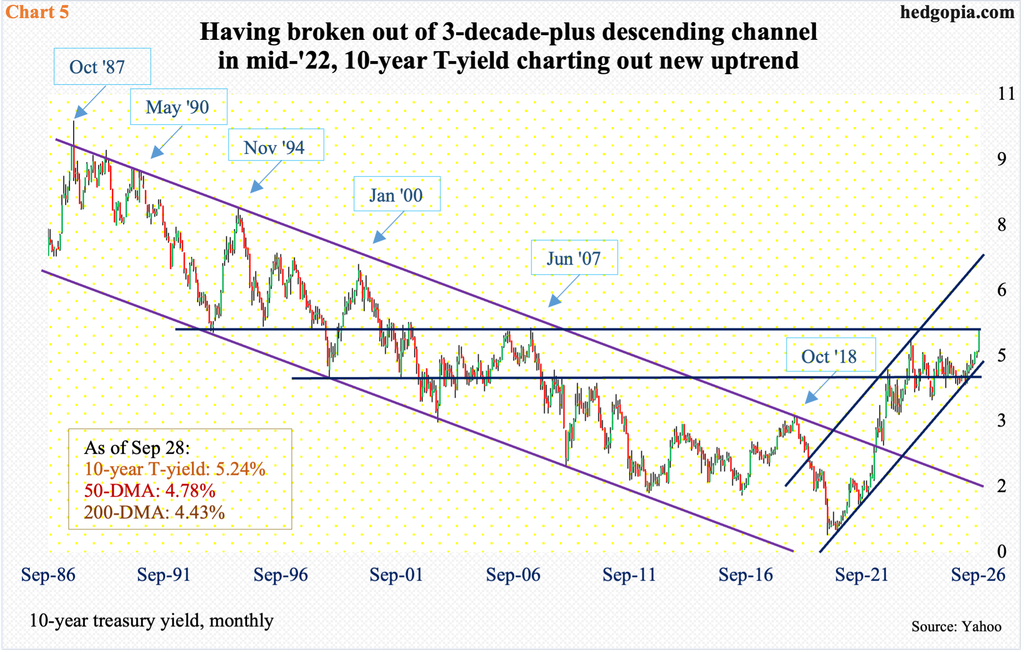
The 10-year treasury yield has been leading. It bottomed in February this year at 3.96 percent and ended Monday at 5.24 percent, with an intraday high of 5.27 percent. Rates have not been this high since June 2007.
In fact, the 10-year has been on a new uptrend, having broken out of a three-decade-plus descending channel in the middle of 2022 (Chart 5).
Historically, the major US tech companies were not directly bothered by higher rates as they sat on a cleaner balance sheet, with very little debt load. The ongoing AI investment has turned this phenomenon on its head, as the hyperscalers take on debt to build out data centers.
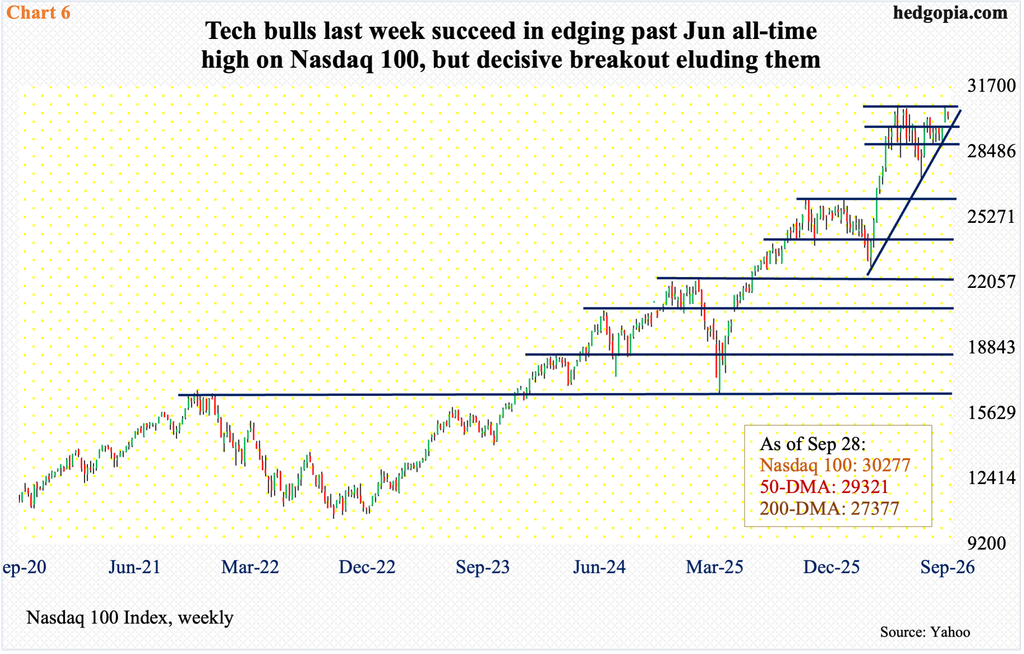
Unlike other major indices like the S&P 500 and Russell 2000, which posted fresh highs in August, the Nasdaq 100 continued to trade under the June 2 intraday high of 30762 – until last Tuesday when it ticked 30771.
This was a perfect setup for tech bulls to continue to get aggressive to decisively push the index higher, but that was not to be. On Monday, the index declined 1.1 percent to 30277. Having now been denied at the prior high, the risk facing the bulls is that the index breaches trendline support from March 30, in which case a test of the 50-day (29321) will be just a matter of time. Then comes horizontal support at 28600s-28800s (Chart 6).
Thanks for reading!
