
Between the January 20th intra-day low of $181.02 and the February 1st high of $194.58, SPY, the SPDR S&P 500 ETF, rallied 7.5 percent… in nine sessions. Too much too fast? Probably.
That said, this was preceded by a nearly 13-percent decline in 14 sessions. Viewed this way, the recent rally is just making up for some of that loss (Chart 1).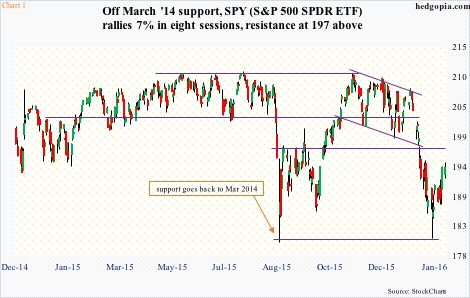
During that waterfall drop, SPY was pushed deep into oversold territory before staging a massive reversal nine sessions ago. The quick seven-plus percent rally has pretty much unwound the daily overbought conditions. Although on a weekly basis, it has tons of unwinding left still. But for that to take place uninterrupted, catalysts are needed.
The two-week, 13-percent decline was primarily a result of investor nerves around China slowdown and collapse in oil price.
Manufacturing continues to contract in China. The January PMI (government-compiled) came in at 49.4, down from 49.7 month-over-month. This was the sixth consecutive month of contraction. Separately, the Caixin survey, which is geared toward smaller firms, rose from 48.2 in December to 48.4, but showed contracting activity for the 11th straight month.
As relates to oil, between the January 20th intra-day low of $27.56 and the January 28th high of $34.82, spot West Texas Intermediate crude rallied north of 26 percent – partly attributable to unwinding of oversold conditions and partly to rumors of possible cuts in production.
The rally brought the WTI right underneath resistance at $34.50-$35, which was unsuccessfully tested last Thursday. Come Monday, as prospects for production-cut deal faded, traders bailed. The spot lost seven-plus percent.
Through all this, crude supplies have continued to rise. In the week ended January 22nd, U.S. crude stocks rose 8.4 million barrels, to 494.9 million barrels – the highest ever (data goes back to 1982).
Both these issues – China and oil – have the potential to reenter traders’ psyche.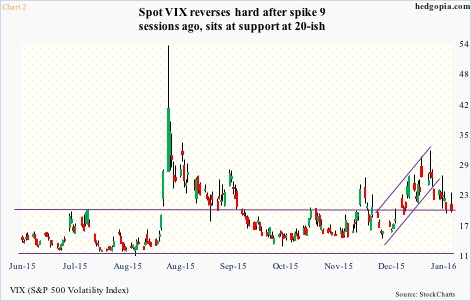
From the bulls’ perspective, the good thing yesterday was that early weakness was bought. Buyers showed up near SPY’s 20-day moving average. Simultaneously, spot VIX was repelled by its 10-day moving average, and is literally sitting on its 50-day moving average; should this support give way, VIX could be eyeing the 200-day moving average (17.55).
Under this scenario, SPY ($193.65) could very well be heading toward 197, where resistance is massive.
Longs can either wait for that breakdown retest or be proactive and act now. Yesterday, early weakness was bought, but volume was anemic. Every trader and his dog knows that if the ETF gets to that resistance, there is likely to be an avalanche of selling pressure. The price may not even get there at this time.
With this in mind, it may be a little early to exit the hypothetical trade initiated on January 12th, but as they say, bulls make money, bears make money, pigs get slaughtered.
To recall, back then, January 15th SPY 191 puts were sold for $1.68, resulting in an effective long at $189.32. A closure ensures a profit of $4.33.
Thanks for reading.
