Wednesday, the FOMC met. The fed funds rate went up another 25 basis points to between 1.5 percent and 1.75 percent. One would think this would drive market action. But looking at a diverse set of assets, technicals played a bigger role in the session than the Fed decision.
Pre-meeting, there was widespread speculation that the FOMC’s dot plot would signal four hikes this year. But members stuck to their three-hike forecast from last December. The so-called dovish hike in normal circumstances should have helped stocks. For a while, this was precisely how things transpired, but technicals came in the way.
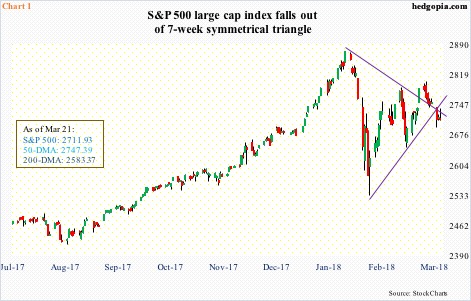
Right after the rate decision at 2 P.M., the S&P 500 large cap index jumped to 2739.14, but ended up the session down 0.2 percent to 2711.93 (Chart 1). A similar post-FOMC statement jump in the Dow Industrials and the Nasdaq 100 – to name two – met with selling, respectively down 0.2 percent and 0.5 percent in the session.
Where did the sellers show up?
On the S&P 500, the intraday high lied between the 20- and 50-day moving averages. The Dow Industrials – also below its 50-day – was rejected at the 10- and 20-day. The Nasdaq 100 was rejected at the 20-day but buyers supported the 50-day. The Russell 2000 small cap index, which is above its 50-day, was denied at the 10-day, but managed to rally 0.6 percent anyway.
The action in small-caps is even more interesting as investors/traders tend to gravitate toward this group when they are on risk-on mode versus large-caps. But then again gold ($1,321.50/ounce), which is traditionally treated as risk-off, rallied, up 0.7 percent in the session.
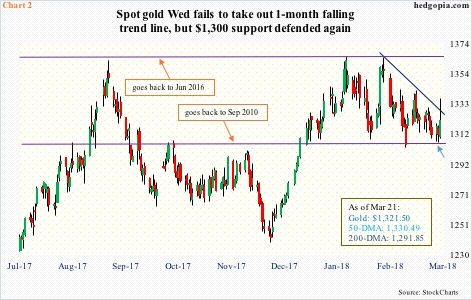
Technically, gold bugs have defended crucial support at $1,300 for three weeks now. Both Monday and Tuesday, the metal fell to $1,306-1,307 (blue arrow in Chart 2). This is also where the daily lower Bollinger band lied. Wednesday, gold opened near those lows and was bid up all day. At one point, it was up 1.9 percent, but sellers showed up right at the upper Bollinger band. The metal is below the 50-day.
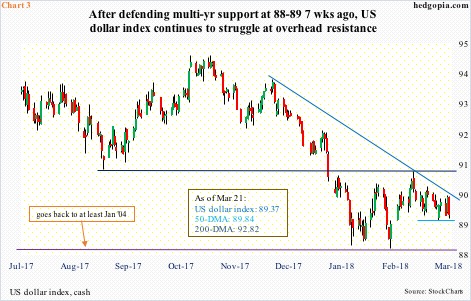
It is possible gold also fed off of a lower dollar on Wednesday. The US dollar index was once again denied at the 50-day. The index has tried to rally past that average for three weeks now, but unsuccessfully. Tuesday, it essentially closed on it. Wednesday, sellers showed up right at the open, and selling accelerated post-FOMC decision. One would think a higher fed funds rate would help, but that has not been a factor for a while now.
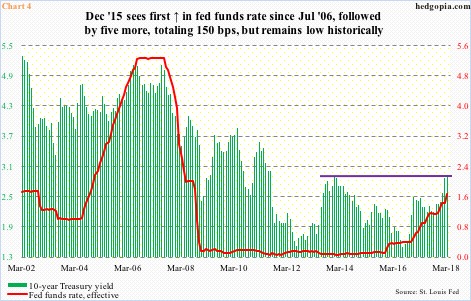
After keeping the fed funds rate near zero for seven long years, the Fed started hiking in December 2015. Since then, rates have gone up by 150 basis points (Chart 4). Back then, the dollar index was just north of 100. Wednesday, it fell 0.7 percent to 89.37, and is once again testing crucial support at 88-89 (Chart 3).
Speaking of which, 10-year Treasury yields Wednesday rose three basis points to 2.91 percent. Intraday, they rose as high as 2.94 percent, in the end producing a long-legged doji session.
The 10-year rate has been trapped in a three-decade-old descending channel, with the upper bound right around here. Since it is a falling channel, a breakout will occur sooner or later. Bond vigilantes therefore are probably closely watching three percent, which was last hit in late 2013/early 2014. Yields have gone sideways in the 2.9-percent range for six weeks now. If – big IF – this resistance convincingly gets taken out, this will reverberate through a whole host of assets, not to mention the economy. No matter whether the Fed hikes two or three more times in the remaining six scheduled meetings this year.
Technicals are worth paying attention to. The S&P 500, for instance, has fallen out of the symmetrical triangle it was in (Chart 1).
Thanks for reading.

