The Federal Open Market Committee begins its two-day meeting today, the significance of which cannot be stressed enough. A lot is riding on this. After this meeting, there will be two more left this year – one late October and one mid-December. What comes out of this meeting will decide if the remaining two will be viewed as insignificant or of consequence.
If the Fed hikes and then gives a nod and a wink that they are ‘one and done’, the remaining two this year will end up being nondescript. Risk-on assets could not be asking for more in this scenario. If on the other hand there is no hike, but the Fed maintains its data-dependency posture, a sword of uncertainty will continue to hang over markets’ heads.
Which way might they go?
Prior to the August 11th yuan devaluation by China, it increasingly looked like the FOMC – at least a good majority of the voting members – was leaning toward a hike come September meeting. Now their message is not as uniform. Of late, there has been a distinct rise in volatility in global financial markets. The division among FOMC members has gotten quite stark.
At Jackson Hole, Stanley Fischer, Fed vice chair, hinted a September hike is still on the table. Just a few days before that, Bill Dudley, president of the New York Fed, was not so sure.
Staying with the U.S., the economy, as is the case with FOMC members, continues to send a conflicting message. In the end, their decision likely depends on what sets of data they give more weight to.
If between jobs and inflation the focus shifts to the former the decision to hike becomes easier. If it is on inflation instead, the case for a ‘wait and see’ strengthens. Even within their dual mandate, there are conflicting signals.
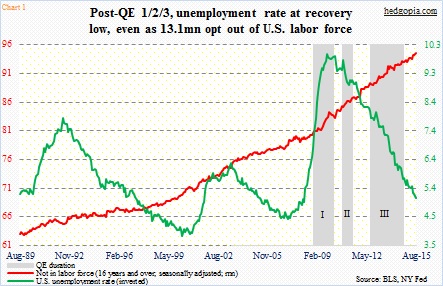
If they focus on the unemployment rate, it is a go, but not so if they consider for instance the number of Americans that have opted out of the workforce. In August, the unemployment rate dropped to 5.1 percent – nearly cut in half from 10 percent in October 2009 – but at the same time there are 94 million Americans that are not in the labor force, versus 81 million in June 2009 (Chart 1). Is QE – or zero interest-rate policy, for that matter – a success or a failure?
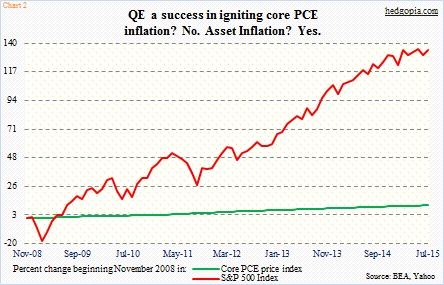
Within inflation, core PCE (personal consumption expenditures) inflation grew at a seasonally adjusted annual rate of 1.2 percent in August – the lowest since March 2011. The last time it grew at two percent – the Fed’s stated goal – was in April 2012. The first iteration of QE was launched in November 2008, along with zero-bound Fed funds rate. Since then, the PCE price index has gone up a puny 10.3 percent. The S&P 500 index, on the other hand, has surged a massive 134.7 percent (Chart 2). Consumption versus asset, which inflation would/should the Fed be focusing on?
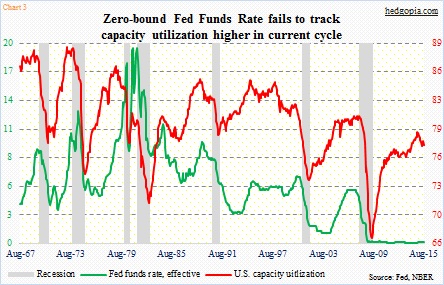
Even yesterday, retail sales in August hung in, up 0.2 percent month-over-month. At 2.2 percent, year-over-growth has decelerated from 4.9 percent a year ago, nevertheless it is growth, not contraction. Capacity utilization, however, has had negative annual growth the past four months. In August, the reading was 77.6, down from the cycle peak of 79.04. Historically, it is rare for the Fed to begin to tighten once utilization has already peaked and on its way down. With that said, it is also rare for Fed funds to remain near zero given where utilization is (Chart 3).
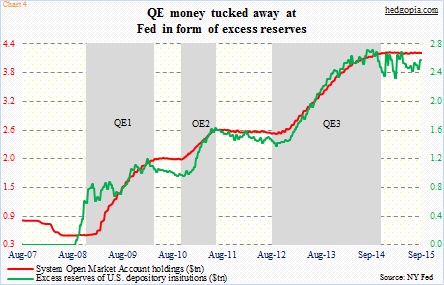
Makes one wonder, has the Fed missed a window of opportunity? Should they have moved while utilization was still rising? Maybe if we focus on utilization, but maybe not if we focus on the green line on Chart 2. One reason inflation – at least the one the Fed focuses on – is as low is due to a mismatch between demand and supply. Commodities are a perfect example of this. If end-demand was strong, U.S. banks would probably not be sitting on $2.6 trillion in excess reserves, earning a mere 25 basis points in interest (Chart 4).
That is the dilemma the Fed faces. Continue ZIRP and run a risk of the status quo in which the red line in Chart 2 continues higher while the green line struggles to stay above the watermark or begin to tighten to possibly see the red line in Chart 3 continue lower. A ‘heads you win, tails I lose’ situation.
It is hard to guess how markets will end up reacting to the decision tomorrow. Here is a worse-case scenario: The long end of the yield curve rallies (rates go lower) if they hike, or stocks sell off if they don’t.
Thanks for reading!

