
Last March, the Fed essentially urged investors to take on risk and go up the risk curve. They have obliged. Leverage is high in the system. This works as long as the prevailing upward momentum is in place. When a reversal occurs, it is bound to be painful. It is a good time to buy some protection, which is cheap.
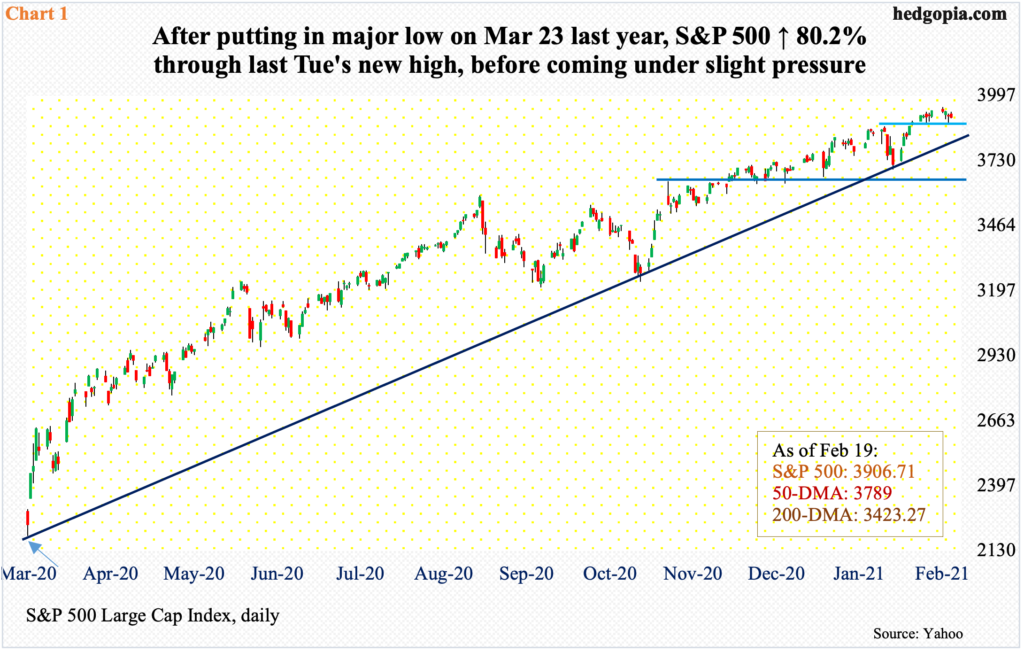
Last March, as Covid-19 began to create havoc, stocks were in free fall and bonds were getting bid up, the Fed got to work. On March 23, it announced unlimited quantitative easing and also said it would start buying investment-grade corporate bonds, which in April was expanded to also include junk bonds. The S&P 500 bottomed in that very session. Earlier on the 9th that month, the 10-year treasury yield (1.35 percent) had already bottomed at 0.4 percent.
From that low through last Tuesday’s fresh intraday all-time high of 3950.43, the S&P 500 (3906.71) is up 80.2 percent. In late January, there was a mini selloff, and buyers were waiting on a trend line from that low (arrow in Chart 1). This support, which now approximates short-term straight-line support at 3870s, could once again get tested in the sessions ahead.
Investors have heeded the Fed’s call. Last March, the message from the central bank was clear: take on risk and move up the risk curve. They have obliged.
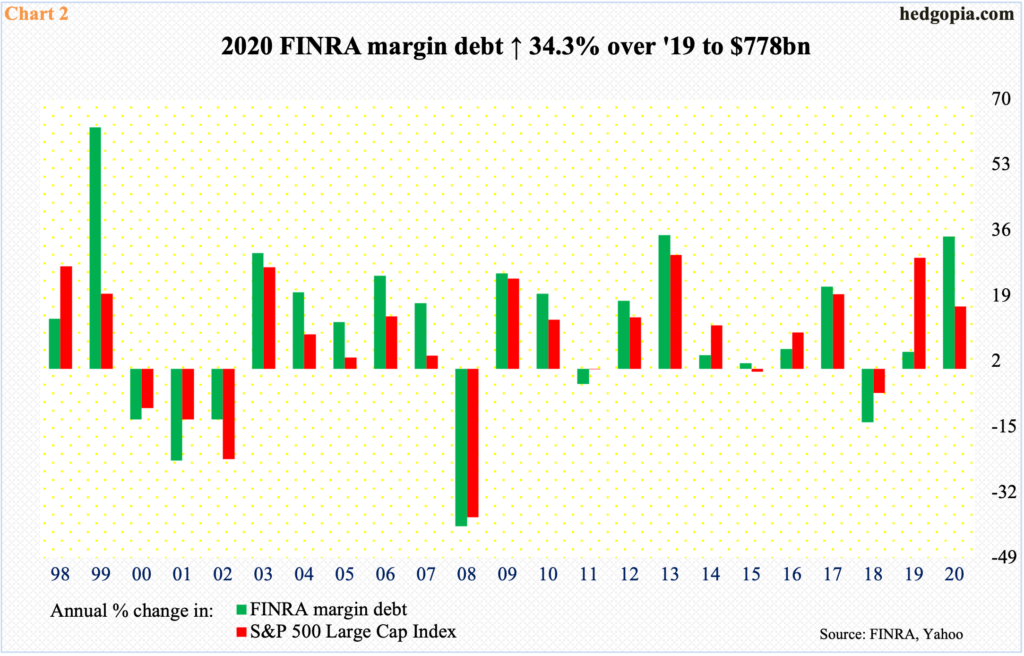
Investor willingness to take on leverage has gone through the roof. In five short weeks last February and March, the S&P 500 collapsed 35 percent. FINRA margin debt declined from $579.2 billion in December 2019 to $479.3 billion in March 2020. Then it shot up. It surpassed the record high of $668.9 billion from May 2018 last November when margin debt rose to $722.1 billion. By January this year, a new record of $798.6 billion was recorded (monthly chart here).
In all of last year, margin debt jumped $198.8 billion, or 34.3 percent; the S&P 500 rallied 16.3 percent. There is a strong relationship between the two, with a correlation coefficient of 0.94 percent (Chart 2).
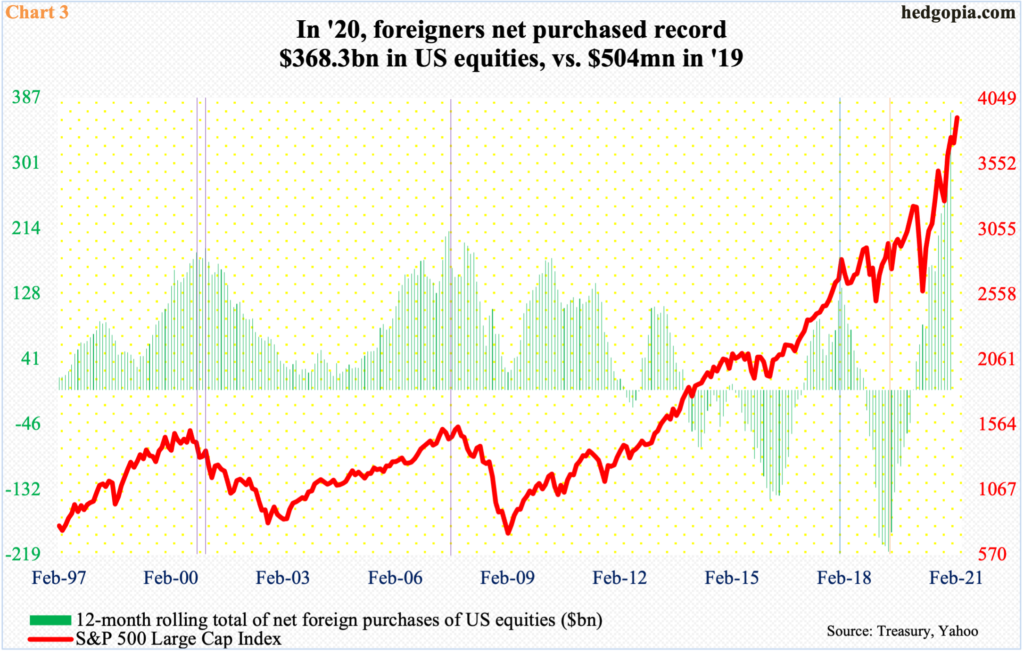
So convinced were foreigners of the so-called Fed put that they used the selloff of last February and March as an opportunity to load up on US stocks. They had already been raising exposure and this did not stop in February and March, when they purchased $11.7 billion and $2.6 billion worth respectively.
Earlier, in the 12 months to April 2019, they were selling as much as $214.6 billion worth – a record (orange vertical line in Chart 3). By the end of that year, net selling had turned into net buying – but only $500 million on a 12-month basis. One year later, this swelled to $368.3 billion. In other words, foreigners’ purchases went from $500 million in 2019 to $368.3 billion in 2020. From their perspective, it is full-on risk-on.
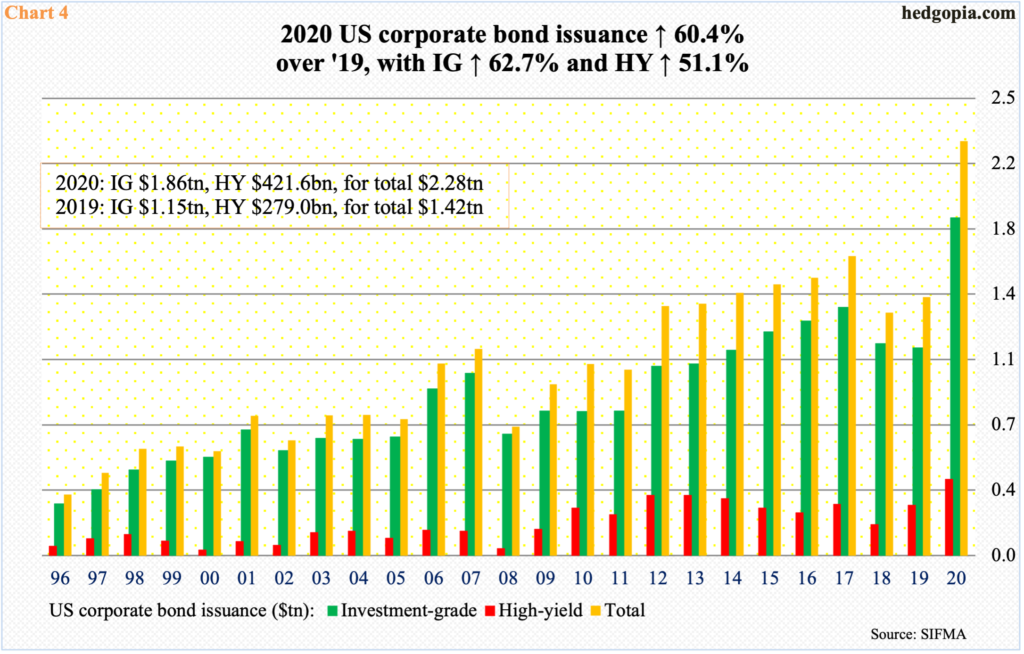
US corporations are fully on board the risk-on train as well. As the Fed essentially provided a backstop to corporate bonds and rates headed south on the back of this, issuance took off.
In 2020, corporate bond issuance surged 60.4 percent to $2.28 trillion. Of this, investment-grade increased 62.7 percent to $1.86 trillion and high-yield 51.1 percent to $421.6 billion. All three categories set new records last year (Chart 4).
The momentum has more or less continued in January, with total issuance of $162.7 billion, made up of $110.4 billion in investment-grade and $52.3 billion in high-yield.
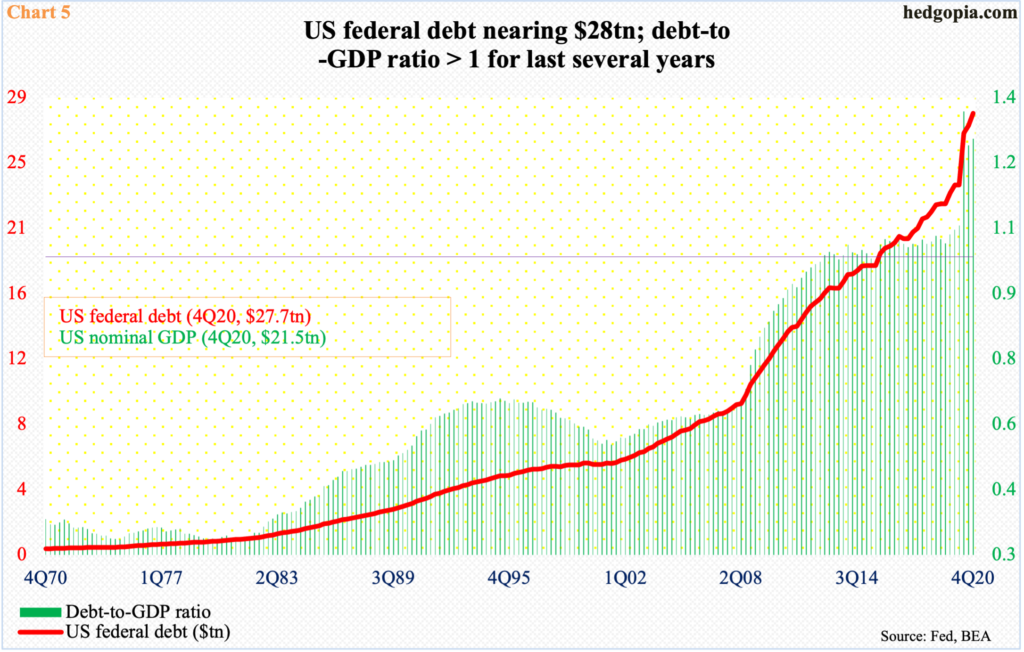
Speaking of which, after growing $4.5 trillion last year, momentum in federal debt has continued this year. With less than two months in, it is already up $200 billion, to $27.9 trillion.
Last year’s massive addition in leverage was the highest one-year total ever. The debt load has doubled in a decade. As a result, except for a couple of quarters, the debt-to-GDP ratio has been north of one the last eight years (Chart 5).
The government is running up debts like drunken sailors, as it needs to fund the soaring budget deficit. In the 12 months to January, issuance of treasury notes and bonds totaled $1.76 trillion. This needs to be funded.
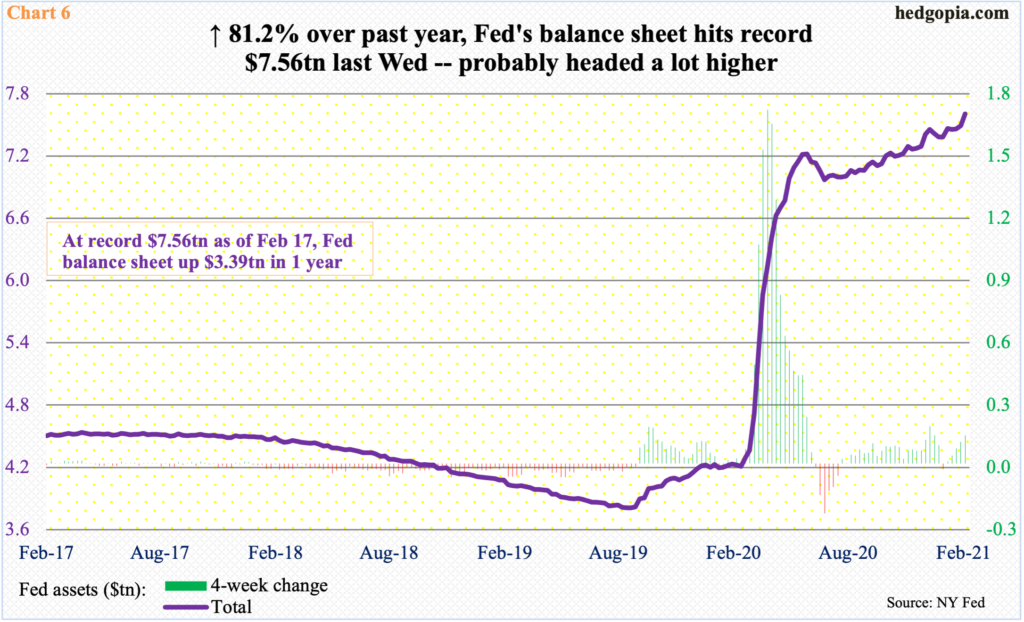
For a while now, foreigners have been avoiding US debt. Last year, they cut their holdings of treasury notes and bonds by $540 billion, up from $133.5 billion in 2019 (chart here). They have gone the opposite way of the Fed, which continues to support this market. The central bank’s holdings of treasury notes and bonds went from $2.03 trillion in early March last year to $4.11 trillion now. Its overall assets between the periods went from $4.24 trillion to $7.56 trillion. The bulk of this spike came between early March and mid-June (Chart 6). After a brief pause, the balance sheet is trending higher again.
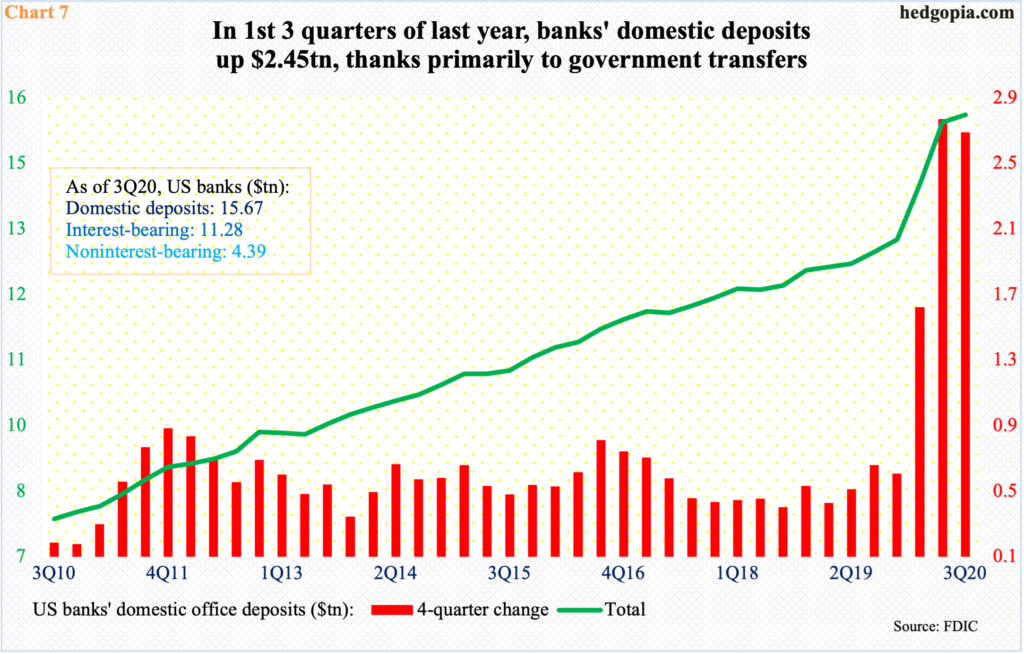
If there is any positive aspect – if it can be called that – to all this debt accumulation, it is that the Covid-related government transfers in the form of unemployment claims and stimulus checks have resulted in swelling bank deposits.
The FDIC will release 4Q20 numbers tomorrow. But as of 3Q20, US banks’ domestic office deposits stood at $15.7 trillion, up from $13 trillion a year ago. Deposits spiked in 1Q20 and the trend persisted the next two quarters (Chart 7).
This is one reason why equity bulls are so gung-ho about growth in the first place, hoping all this socked-away cash makes its way into the economy. This may very well happen, but there is one problem to this thesis.
The post-pandemic recovery has been uneven.
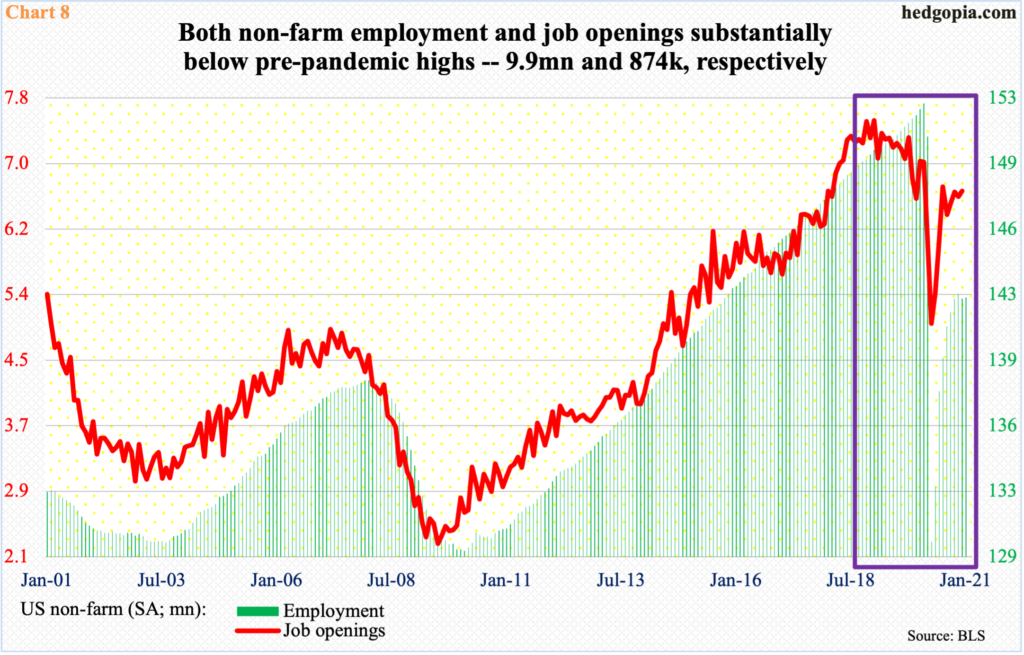
Nominal GDP came in at $21.48 trillion in 4Q20 (2nd print will be published Thursday this week), just slightly off the record high of $21.75 trillion in 4Q19. But employment numbers are massively lagging behind (box in Chart 8).
Pre-Covid, non-farm payroll reached a record 152.5 million. In the next couple of months, it tumbled to 130.1 million. From the April low through January’s high, 12.5 million jobs were added, but they are still 9.9 million short of February’s high.
Similar dynamics are at play in job openings, which hit their record high of 7.52 million all the way back in January 2019. Just before Covid-19 began disrupting the economy, openings were 7.01 million in January 2020, before cratering to five million by April. The recovery since that low has been subdued, with December at 6.65 million.
The Fed is focused on employment, which suggests it will keep the monetary policy easy just to create enough jobs to drive it to pre-pandemic level. This is what equity bulls have modeled in, expecting the Fed’s balance sheet to head much higher in months/quarters to come. The only way this scenario fails to materialize is if the short end of the yield curve begins to price in overheating in the economy and higher rates. Thus far, the 10-year treasury yield is perking up, but not the two-year yield.
Big picture, there is nothing natural about all this. All this money-printing and investor penchant for leverage is destined to end badly. The question is of timing, and it is impossible to do that given all the variables at work. What we do know is that protection is very cheap in the options market. It may not be a bad idea to put some on.
Thanks for reading!
