
The FOMC concludes its two-day meeting later today. Rates on the short end of the yield curve are behaving but the long end is perking up. This is taking place at a time when foreigners are aggressively selling treasury notes and bonds. The Fed, in contrast, is a buyer of these securities, but markets want more, hoping for some kind of an operation twist.
The FOMC concludes its two-day meeting later today. It is the year’s second, and six more remain. Not much is expected on the rates front. The fed funds rate is already zero-bound. Markets would be more interested in hearing about what the statement, and Chair Jerome Powell later in the press conference, say about the inflation outlook and the recent backup in 10- and 30-year T-rates.
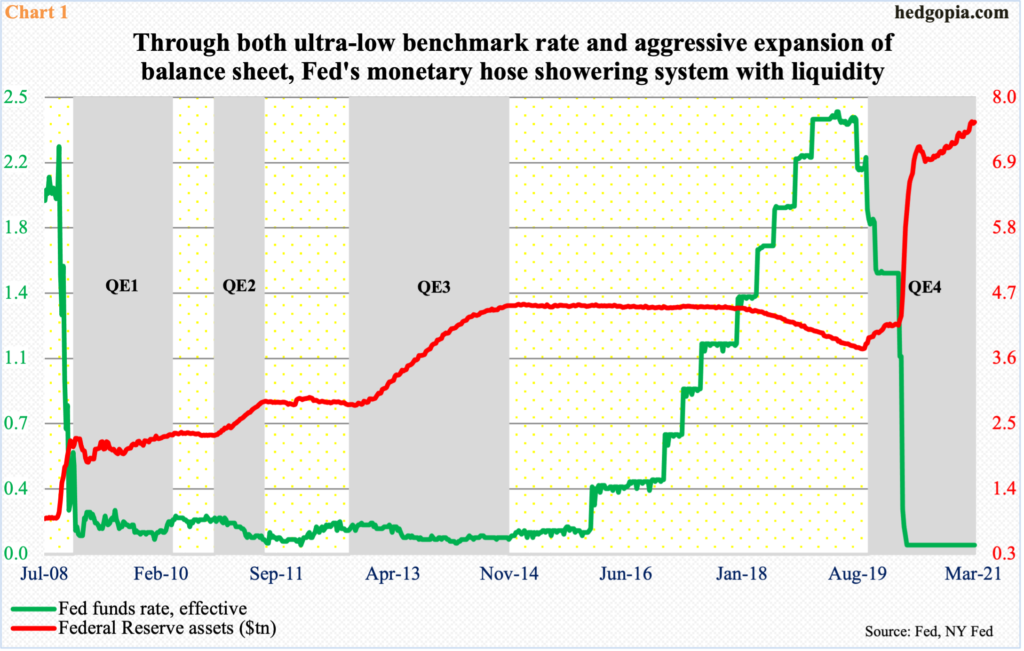
Treasury Secretary Janet Yellen last week brushed off inflation fears owing to the $1.9-trillion stimulus package that just became law, adding they have tools to address it. The conventional tool – the benchmark rate – already lies in a range of zero to 25 basis points (Chart 1). It cannot go any lower, unless rates go negative, the benefit of which is debatable.
Quantitative easing (QE) is the unconventional tool that the Fed has aggressively pursued since pretty much the great financial crisis. In August of 2019, its assets bottomed at $3.76 trillion, before going parabolic last March. Last Wednesday, they had ballooned to $7.58 trillion.
One can argue that the aggressive expansion of its balance sheet is exactly what is causing all the dislocation in the system. Unwinding of this – if ever – is bound to leave behind a trail of cries and tears. Right here and now, markets – both bond and equity – are not too bothered by these prospects.
Of late, the long end of the treasury yield curve is rallying. Inflation fears have grown, given growth prospects this year and the amount of stimulus money – both monetary and fiscal – sloshing around.
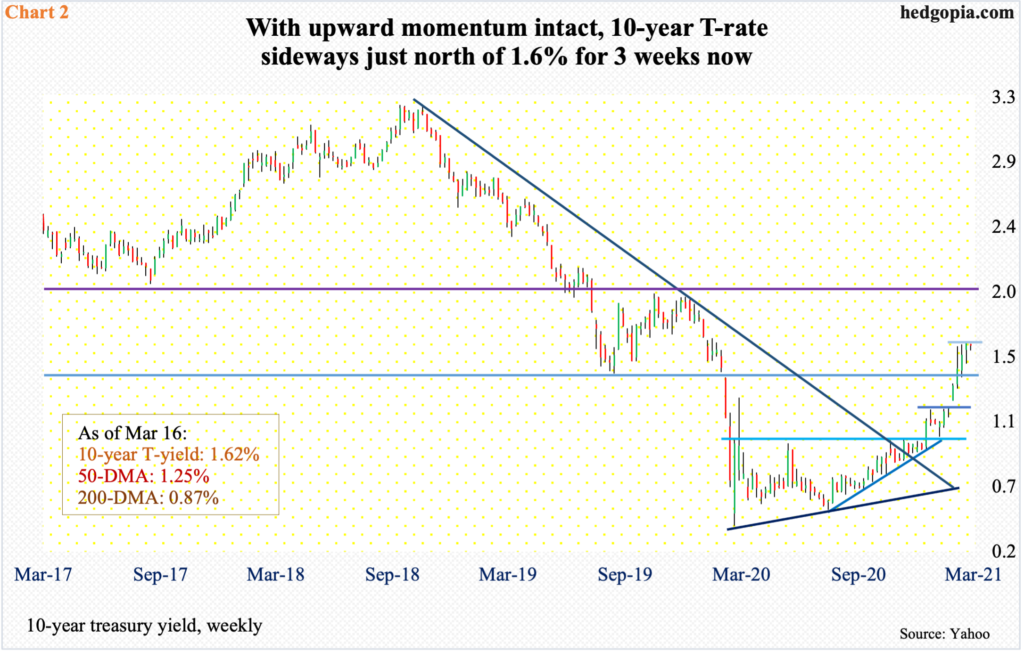
Last March, the 10-year treasury yield bottomed at 0.4 percent. Last Friday, these notes were yielding 1.64 percent. Rates have pretty much gone sideways just north of 1.6 percent the past three weeks, with Tuesday closing at 1.62 percent (Chart 2).
If there is no SLR (supplementary leverage ratio) extension, it is possible the 10-year quickly rallies toward two percent. Last April – post-Covid – US regulators eased SLR requirements, which were put in place in the wake of the great financial crisis. Banks were required to have equity capital equal to three to five percent of their assets back then. Last year’s exemption allowed them to exclude US treasuries and cash kept in reserve at the Fed from their assets when calculating the ratio.
If the exemption is not extended, banks likely will try to reduce their treasury holdings, although it is also possible that, sensing the regulators were not going to extend the exemption, banks have been liquidating at least some of their holdings, putting upward pressure on the rates.
Long rates have trended higher despite aggressive accumulation of these securities by the Fed, which has been spending up to $120 billion/month in mortgage-backed securities and treasury notes and bonds.
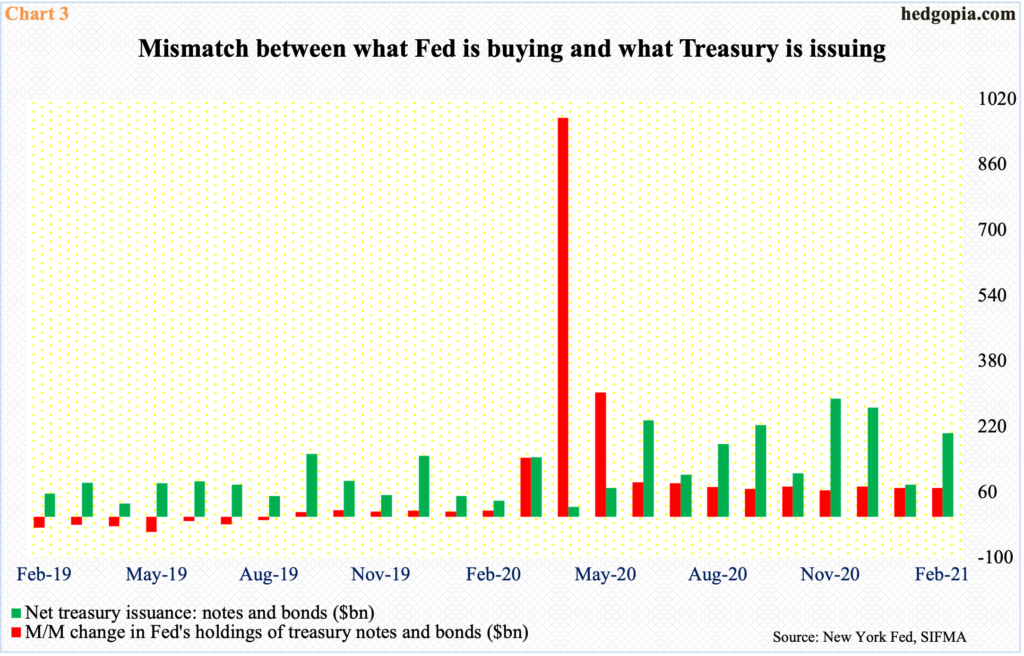
By February, the Fed held $4.12 trillion in treasury notes and bonds, up from $2.17 trillion last March and up $71.2 billion from January. The problem is, there is a wide gap between what it buys and what the Treasury issues. Except for last April and May, this supply-demand discrepancy is evident in Chart 3. In February, for example, issuance of treasury notes and bonds was $204.3 billion.
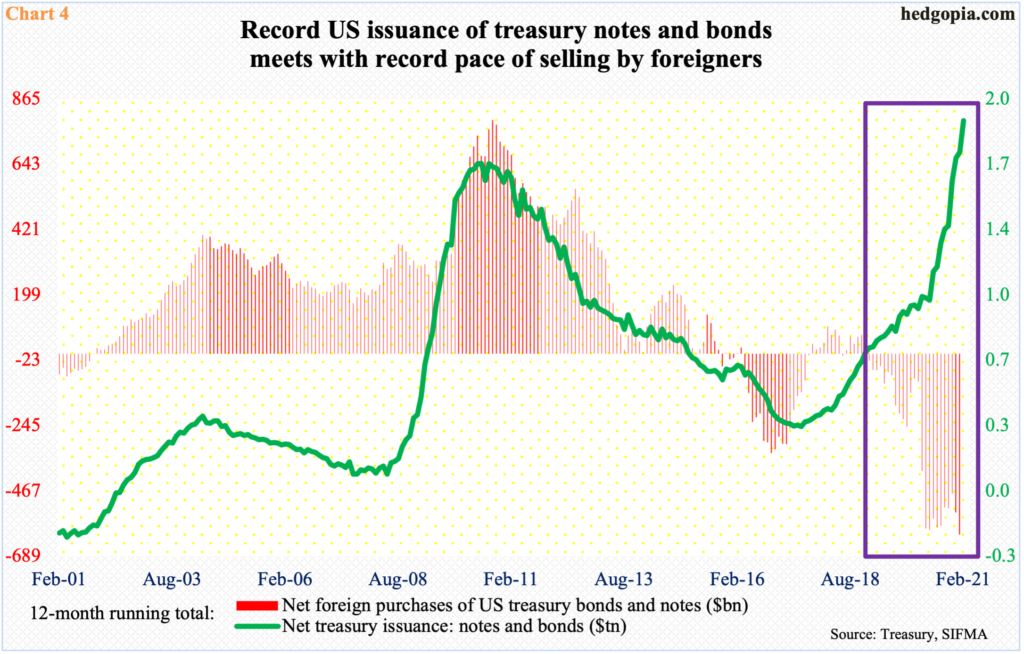
This is coming at a time when foreigners are massively liquidating their holdings of these securities. In the past, their purchases – or a lack thereof – went toe to toe with treasury issuance. But this relationship broke down in the early months of 2019.
In fact, the divergence has picked up steam. In the 12 months to February, issuance was $1.93 trillion. But foreigners continue to go the other way, with net selling of $616.4 billion in the 12 months to January (Chart 4). Both are in record territory.
Either way we look at it, the Fed is between a rock and a hard place. It has expanded its balance sheet in such a way that normalizing it – if ever – potentially causes a negative shock across assets.
One year ago, post-pandemic, the central bank essentially urged investors to take on risk and get on the risk curve, and the latter obliged. Now, anytime the Fed tries to walk back, the latter throws tantrums, and the former hands out goodies. This has driven one after another metric into uncharted territory.
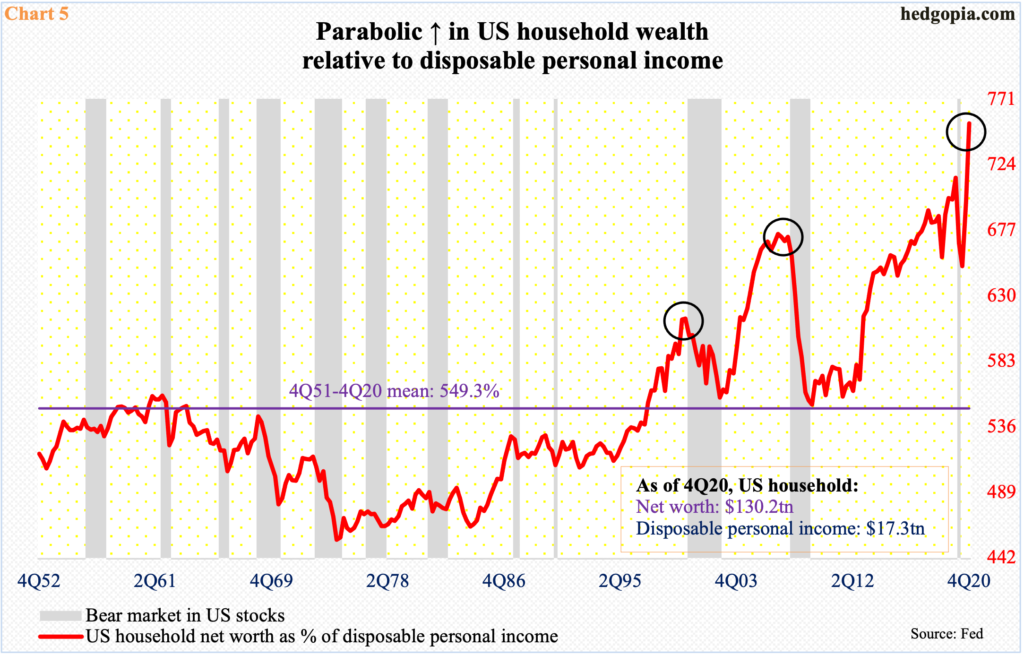
Chart 5 looks at the prevailing parabolic growth in household wealth versus disposable personal income. In 4Q20, net worth comprised 754 percent of disposable personal income – a record. The two are so out of sync, with the red line going vertical in the second half. The question is not about its sustainability – it is not – rather about how the Fed goes about restoring sanity back without any disruption. The longer it waits, the harder it gets.
For now, Mr. Powell later today will try to convince the bond market why an Operation Twist, in which the Fed sells short-term notes and buys long-term notes and bonds, is not the need of the hour. Fingers crossed!
Thanks for reading!
