
As major US equity indices post record highs, margin debt is inching ever closer to its high from May 2018. In all probability, November will have made a new high in margin debt. Amidst all this risk-on behavior, it is worth recalling that margin debt cuts both ways. Historically, unwinding has been painful.
Back in March, both FINRA margin debt and the S&P 500 Large Cap Index bottomed – the former at $479.3 billion and the latter at 2191.86 (chart here). Leading up to that, margin debt peaked in May 2018 at $668.9 billion.
Since that low, the S&P 500 has gone on to rally to north of 3600, with a new intraday record high of 3645.99 on the 9th this month. As of October, margin debt is $9.6 billion from its May 2018 record high. Since March, investors have added $180 billion in leverage. This looks egregious on an absolute basis, but not so if measured as a share of disposable personal income.
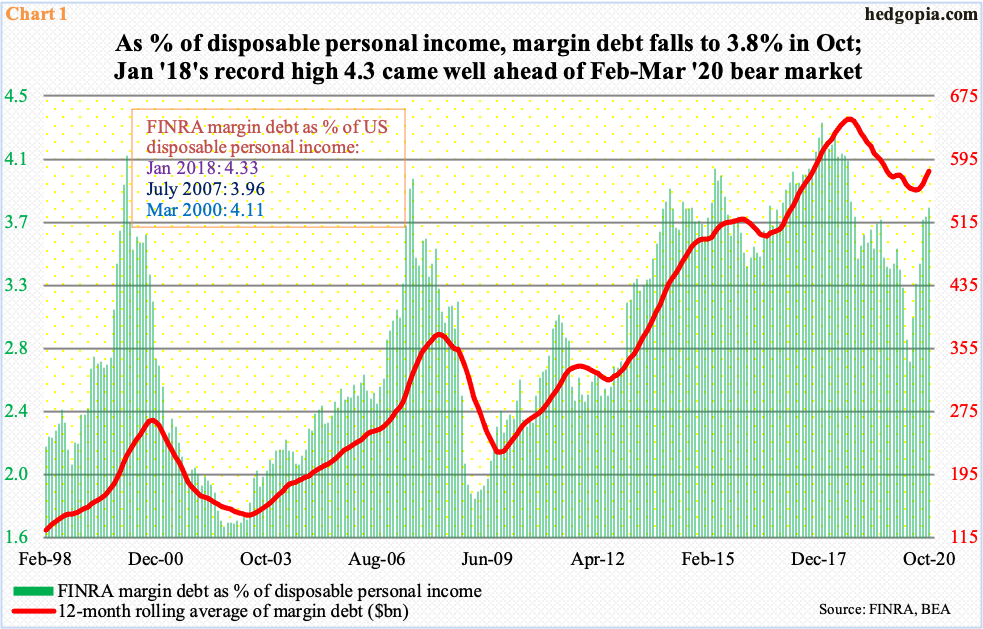
In October, margin debt made up 3.76 percent of disposable personal income, which was $17.5 trillion (seasonally adjusted annual rate). In April, margin debt’s share dipped as low as 2.76 percent, but that was mainly due to an increase in government transfer payments, which totaled $19 trillion.
October’s reading is elevated but not elevated enough versus past peaks. In fact, the all-time high of 4.33 percent was reached in January 2018 (Chart 1). Stocks did come under pressure briefly after that, but only to rally to newer highs. This compares with the prior peaks of July 2007 (3.96 percent) and March 2000 (4.11 percent), which marked major peaks in the S&P 500.
Viewed this way, there is room for margin debt to continue higher.
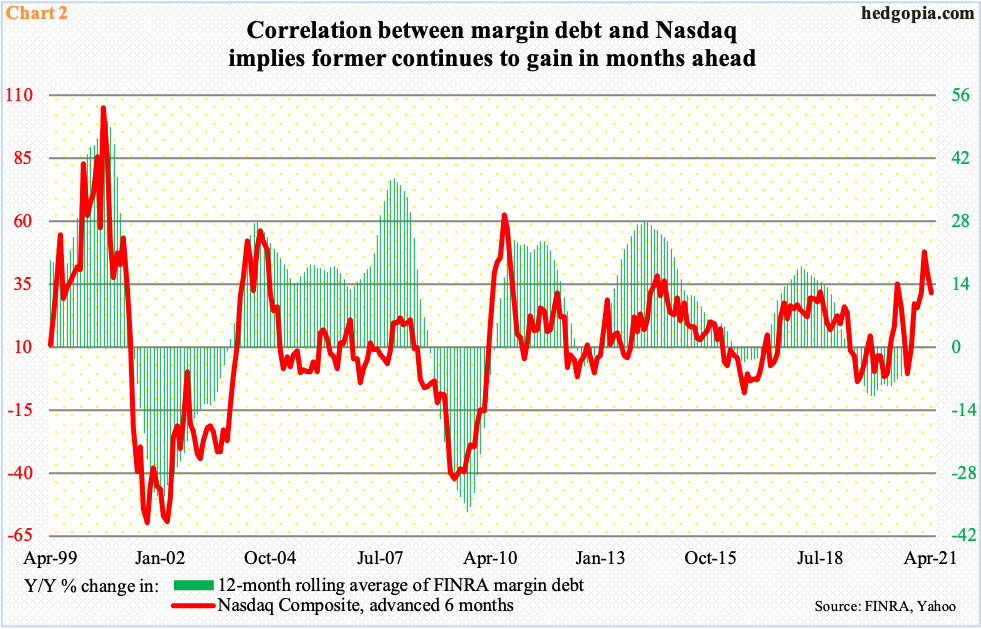
Chart 2 plots the 12-month rolling average of margin debt against the Nasdaq Composite which is advanced six months. In October, margin debt was $580.3 billion on that basis, up 0.9 percent year-over-year. This was the first increase in 19 months, with momentum gradually shifting upward.
If past is prelude and if the two variables maintain their historical relationship, the green bars are headed higher in the months to come.

As a matter of fact, margin debt may already have made a new high this month. The S&P 500 was down in both September and October, but margin debt was up in both those months, adding $13.8 billion, which is not a lot but the message could be significant in that investors were willing to add to leverage taking advantage of the selloff.
With one session to go this month, the S&P 500 is up 11.3 percent, the Nasdaq 100 Index 10.9 percent and the Russell 2000 Small Cap Index 20.6 percent.
The small-cap outperformance in this regard is notable. As mentioned earlier, margin debt peaked in May 2018 and the Russell 2000 in August that year. The latter only took out its old high this month (Chart 3). Otherwise, it was severely lagging its large-cap peers. Post-presidential election, small-caps were already attracting bids and quickly became a go-to sector post-vaccine news.
Small-caps inherently have larger domestic exposure versus their larger-cap brethren which are also internationally exposed. Particularly post-vaccine development, the hope is that the US economy begins to get back to normal next year.
Measured by small-cap performance, risk-on is evident. This raises the odds of a new high in margin debt this month. (November’s data will be out in about a month.) The Russell 2000 and margin debt do have a tighter correlation (0.98 percent) versus both the S&P 500 (0.93 percent) and the Nasdaq 100 (0.87 percent).
Amidst all this, it is important to recall that margin debt is a two-edged sword. As much as it helps on the way up, it hurts on the way down. The aggressive buildup is a sign that optimism is elevated, and it does not take long before it tilts aggressively to one side. Historically, unwinding has always been painful.
Thanks for reading!
