
Just when one thought the North Korean crisis had died down, Kim Jong-un fires another missile. Did gold anticipate this? On Monday, the metal scored what could turn out to be an important breakout.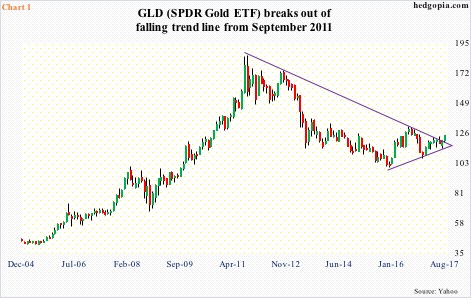
To be fair, gold reached a major bottom as early as December 2015 at $1,045.40/ounce. The corresponding price on GLD (SPDR gold ETF) was $100.23.
Earlier, the metal peaked at $1,923.70 in September 2011 ($185.85 on GLD). Back then, the Fed’s second iteration of quantitative easing ended in June 2011. QE3 began in September 2012, but gold could not get going, making a lower high in October that year (Chart 1).
Fast forward to now, and the Fed is now toying with the idea of reducing its bloated $4.5-trillion balance sheet.
The July 25-26 (FOMC meeting) statement said it “expects to begin implementing its balance sheet normalization program relatively soon.” It is possible it will announce something during the September (19-20) meeting.
In the meantime, gold has broken out – out of a trend line from that September 2011 peak.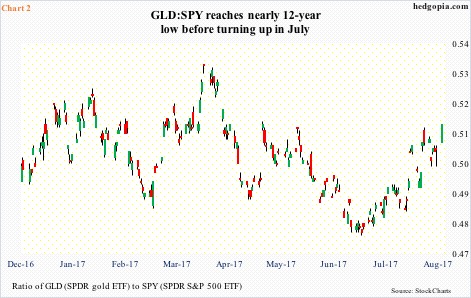
Gold is also faring better on a relative basis – relative to the S&P 500 in particular. Chart 2 plots a ratio between GLD and SPY (SPDR S&P 500 ETF).
In July, GLD:SPY reached the lowest going back to December 2005 before turning up. As did both gold and GLD, the ratio earlier peaked in September 2011. So the July bottom could prove to be important.
Incidentally, the ratio made a lower low in July compared to last December, but several indicators such as the RSI, MACD and the CCI made higher lows on the weekly chart.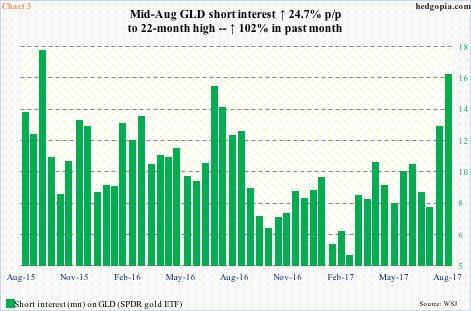
In the latest breakout, shorts probably lent a helping hand.
At mid-August, short interest on GLD stood at a 22-month high, having more than doubled in the past month to 15.9 million. At the end of February this year, it was merely 4.9 million.
Shorts began to add as gold got rejected at its 200-day moving average on February 27, followed by months-long vacillation around that average. They continued to add as the metal faced strong resistance at $1,300 for four months before giving way Monday.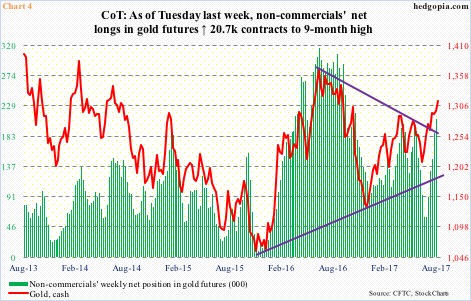
Of late, non-commercials have been adding as well. These traders tend to be trend followers, and the trend has been up in gold.
As of Tuesday last week, net longs in gold futures stood at 208,438 contracts – a nine-month high and up from 60,138 five weeks ago. They have caught the rally since early July perfectly.
Holdings as of today will be published this Friday, and is worth watching – as to whether these traders used yesterday’s breakout as an opportunity to lighten up or add further. It is possibly the latter. We will find out.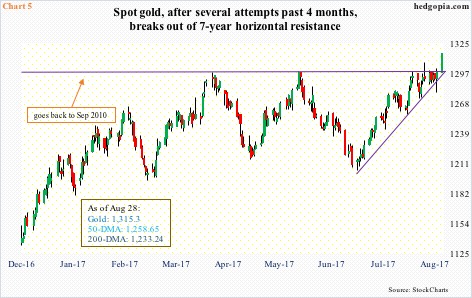
Monday’s breakout could prove to be important.
Resistance at $1,300 goes back to September 2010 (Chart 5).
Volume picked up the past couple of sessions.
As suggested earlier, short squeeze probably helped. As did stops that got taken out.
The daily chart is looking extended. Monday closed well outside the daily upper Bollinger band. If it comes under pressure, both 10- and 20-day – both rising – could provide support. The best the gold bugs can hope for is this. A breakout retest occurs soon, which will end up attracting more buying. This will validate the breakout in Chart 1.
Thanks for reading!
