
With higher lows since the December 2015 trough, gold finds itself right underneath major resistance. A breakout would speak volumes about the global economy and how major central banks would react in response. Near-term notwithstanding, gold bugs deserve the benefit of the doubt medium- to long-term.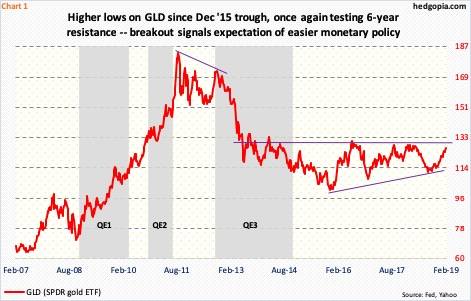
Gold/GLD (SPDR gold ETF) rallied furiously during the first two iterations of US quantitative easing, then peaking as soon as QE2 ended, followed by a lower high as QE3 got underway (Chart 1). The metal likely acted such anticipating and pricing in an end to QE. Now, the opposite could be happening. At least gold bugs hope so.
Until US stocks got routed in October-December last year, the Fed maintained a tightening bias. After leaving the fed funds rate near zero for seven years, it began raising rates in December 2015. The last hike was mid-December last year, to a range of 2.25 percent to 2.5 percent. The FOMC dot plot at the time still expected two more hikes this year, down from three previously projected. Markets do not buy this scenario. In the past several weeks, there has been a decided shift in the Fed’s tone. It has now adopted a “patient” approach. Minutes from the January 29-30 meeting – out Wednesday – showed they also plan to stop reducing the balance sheet later this year.
Thanks to QE, System Open Market Account (SOMA) holdings went from under $500 billion in December 2008 to $4.24 trillion in April 2017. In October that year, the Fed began to run down its bloated balance sheet. As of Wednesday last week, these holdings stood at $3.81 trillion – still massive. Because its conventional monetary quiver does not have enough arrows, in a scenario in which the economy continues to decelerate, the Fed has no other option than to resort to once again expanding the balance sheet. Gold seems to be smelling this.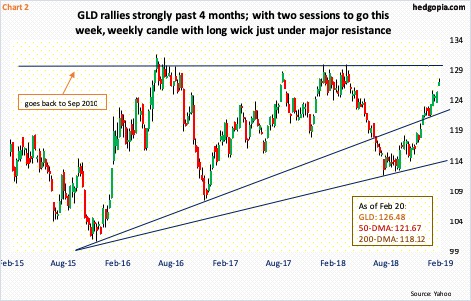
GLD ($126.48) finds itself at a crucial spot. It bottomed in December 2015, followed by higher lows (Chart 2). It is on the verge of what could turn out to be a significant breakout. Resistance at $129-$129.50 goes back to September 2010 (on gold, this approximates $1,360-$1,370).
From the low last August through Wednesday’s high, the ETF jumped 14.5 percent. The rally revved up early October, as stocks took it on the chin and the investing environment shifted to risk-off.
The six-month rally has pushed GLD into overbought territory – on both daily and weekly. Weakness near term is not out of the question. The 50-day moving average lies at $121.67, followed by the 200-day at $118.12. There is also trend-line support from the December 2015 low.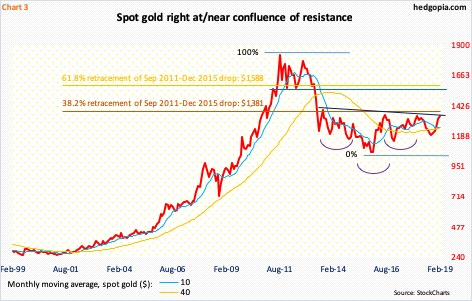
Pause/weakness near term is also possible as, apart from the decade-old horizontal resistance (Chart 2), gold currently faces Fibonacci resistance.
The metal peaked intraday in September 2011 at $1,923.70/ounce. It then bottomed in December 2015 at $1,045.40. A 38.2-percent retracement of this decline lies at $1,381 (Chart 3). This approximates the afore-mentioned horizontal resistance. Bulls have hammered on this ceiling several times in the past – unsuccessfully. But each time resistance like this is attacked, it develops some cracks. A breakout will be massive, opening the door to a possible test in due course of the 61.8-percent retracement at $1,588.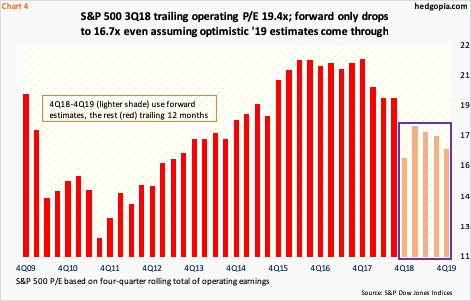
Interestingly, over the past several months, gold has rallied along with both stocks and bonds. From the low on December 26 through Wednesday’s high, the S&P 500 large cap index rallied just under 19 percent. This preceded a 20.2-percent decline between that low and the all-time high of 2940.91 reached on September 21.
The index (2784.70) currently finds itself right underneath crucial resistance at 2800. Daily and weekly conditions are overbought. The rally since late December obviously has put upward pressure on valuations – particularly so as earnings estimates continue to get revised lower.
As of mid-February, just under 85 percent of S&P 500 companies had reported their 4Q. When the quarter ended a month and a half ago, the sell-side expected $40.42 in operating earnings. Last Friday, this was $38.23 (blended). Estimates for 2019 are the same way, peaking early August last year at $177.13. Last Friday, at $166.83, they were more than $10 lower. By far, the first half has borne the brunt of the downward revision, with the second half holding firm. In all probability, 2019 estimates are still optimistic.
If so, the current operating P/E of 16.7x (Chart 4) will continue to rise even if the S&P 500 remains unchanged. As things stand, this is a big headwind for the index. Bulls have had substantial gains in less than two months. The temptation to lock in profit rises once momentum begins to wane. It has not happened yet. But risks rise with each passing day, as earnings estimates continue their downward-revision trend and as overbought technicals itch to unwind. In a risk-off environment, gold can attract bids.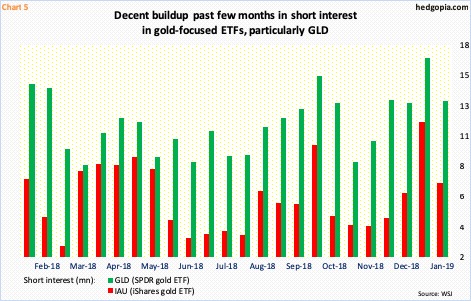
Short interest in gold-focused ETFs – GLD (SPDR gold ETF) and IAU (iShares gold ETF) – can help.
Shorts began to add in the second half of November. Mid-January, GLD’s was at a one-year high and IAU’s was at a 16-and-a-half-month high. They both fell period-over-period in the last half last month, but GLD’s in particular is still elevated. It is possible shorts continued to exit as gold continued to rally. We will find out when mid-February numbers are reported next Wednesday.
But for gold/GLD to take out the aforementioned resistance and begin a new leg of strength, short squeeze alone will not cut it. For that, a massive change in investor perception is needed – about how the global economy was unfolding and how central banks, which have nothing much to show for in the way of conventional tools, would respond with unconventional tools such as QE. Medium- to long-term, gold bugs deserve the benefit of the doubt.
Thanks for reading!
